How to Use
This guide explains how to use the app.
Basic Usage
Section titled “Basic Usage”- Move the map to position the center pin over your desired farmland location, or enter coordinates in the search form to move to the desired location. You can also tap the map to move the map center to the tapped point.
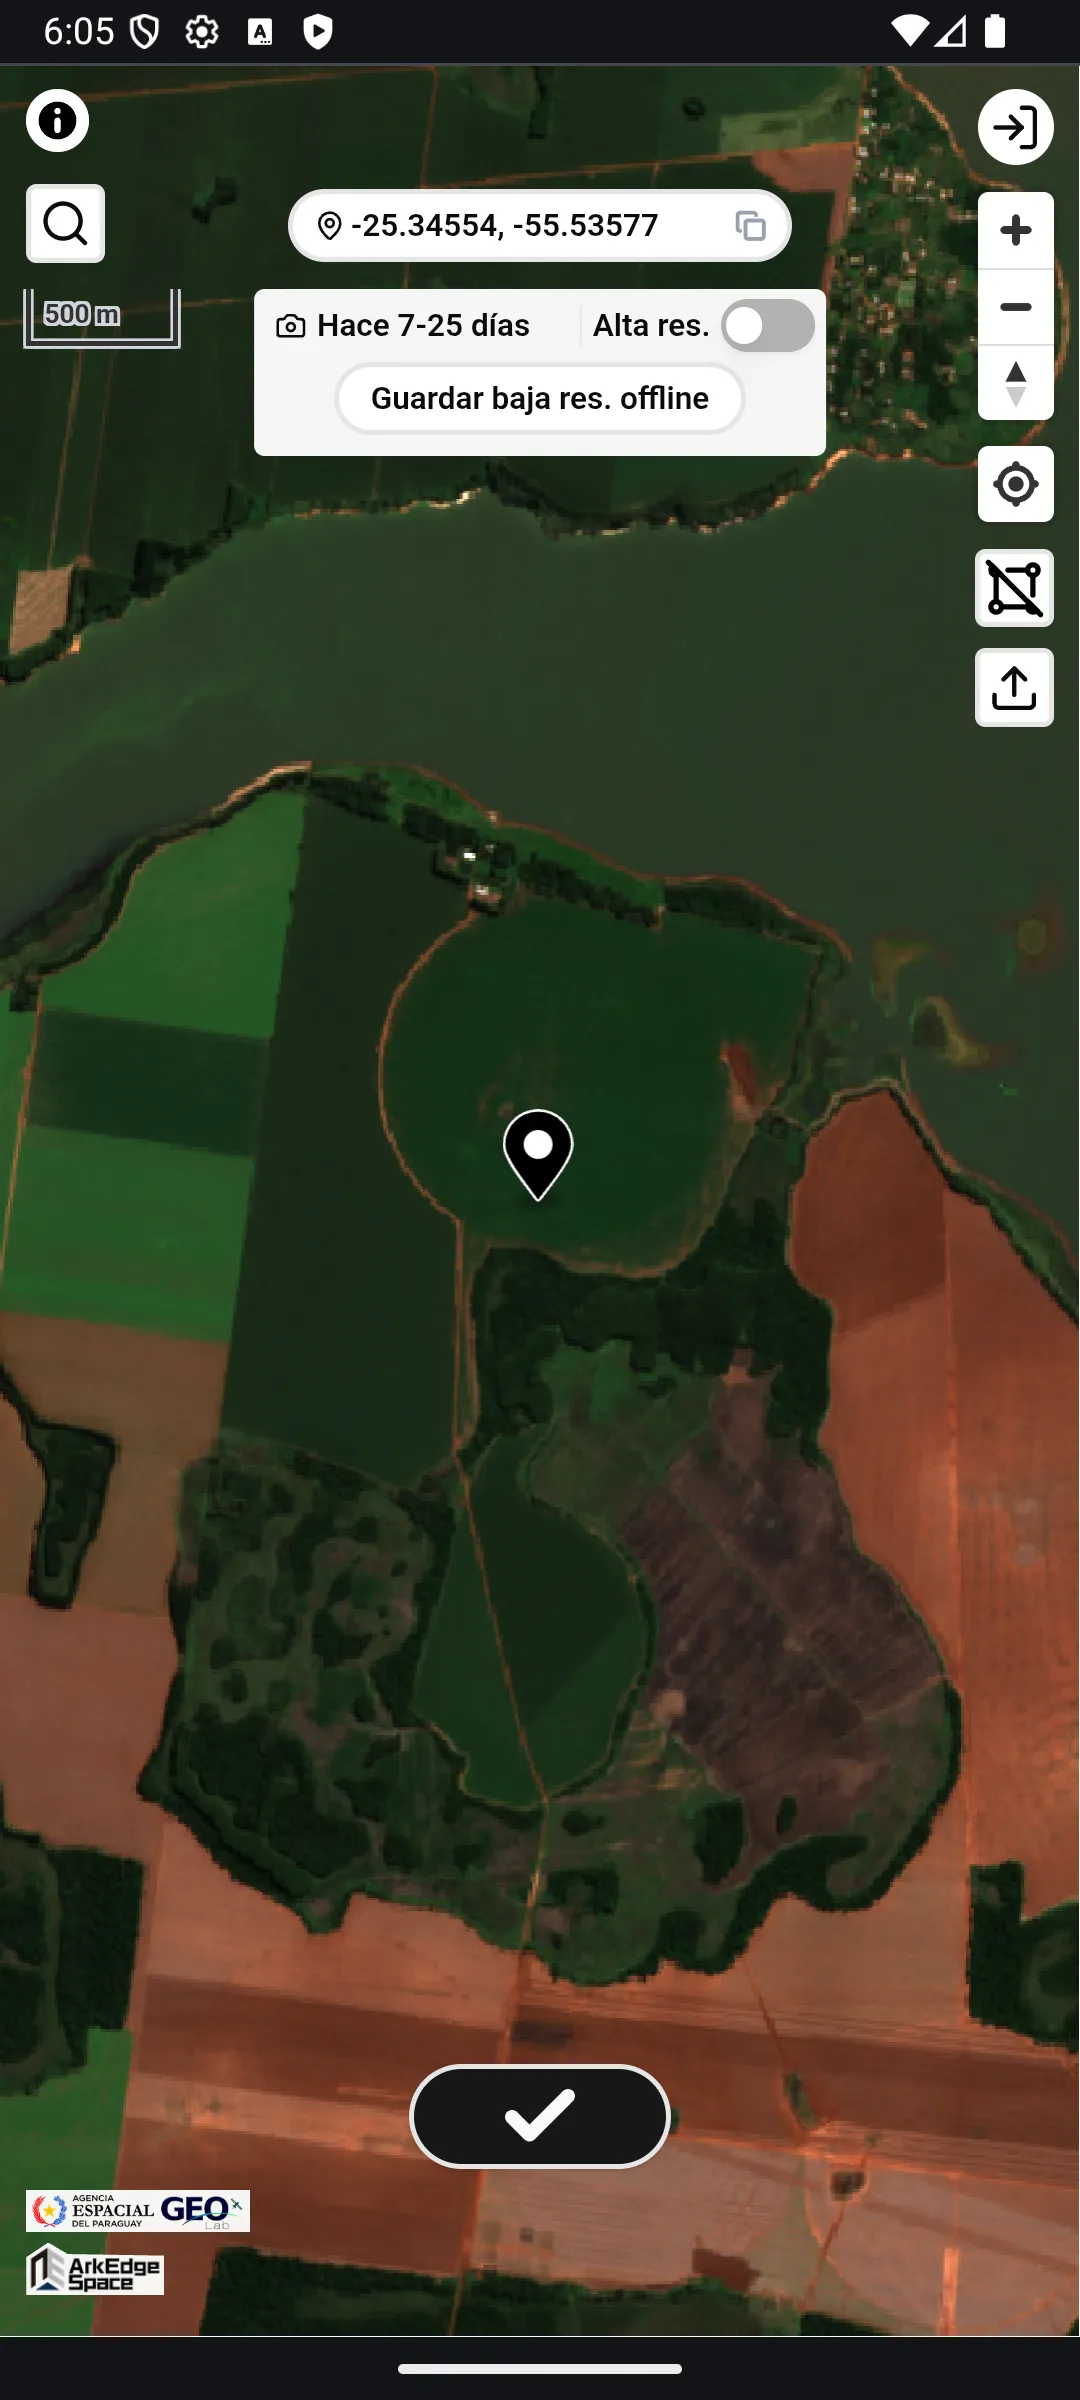
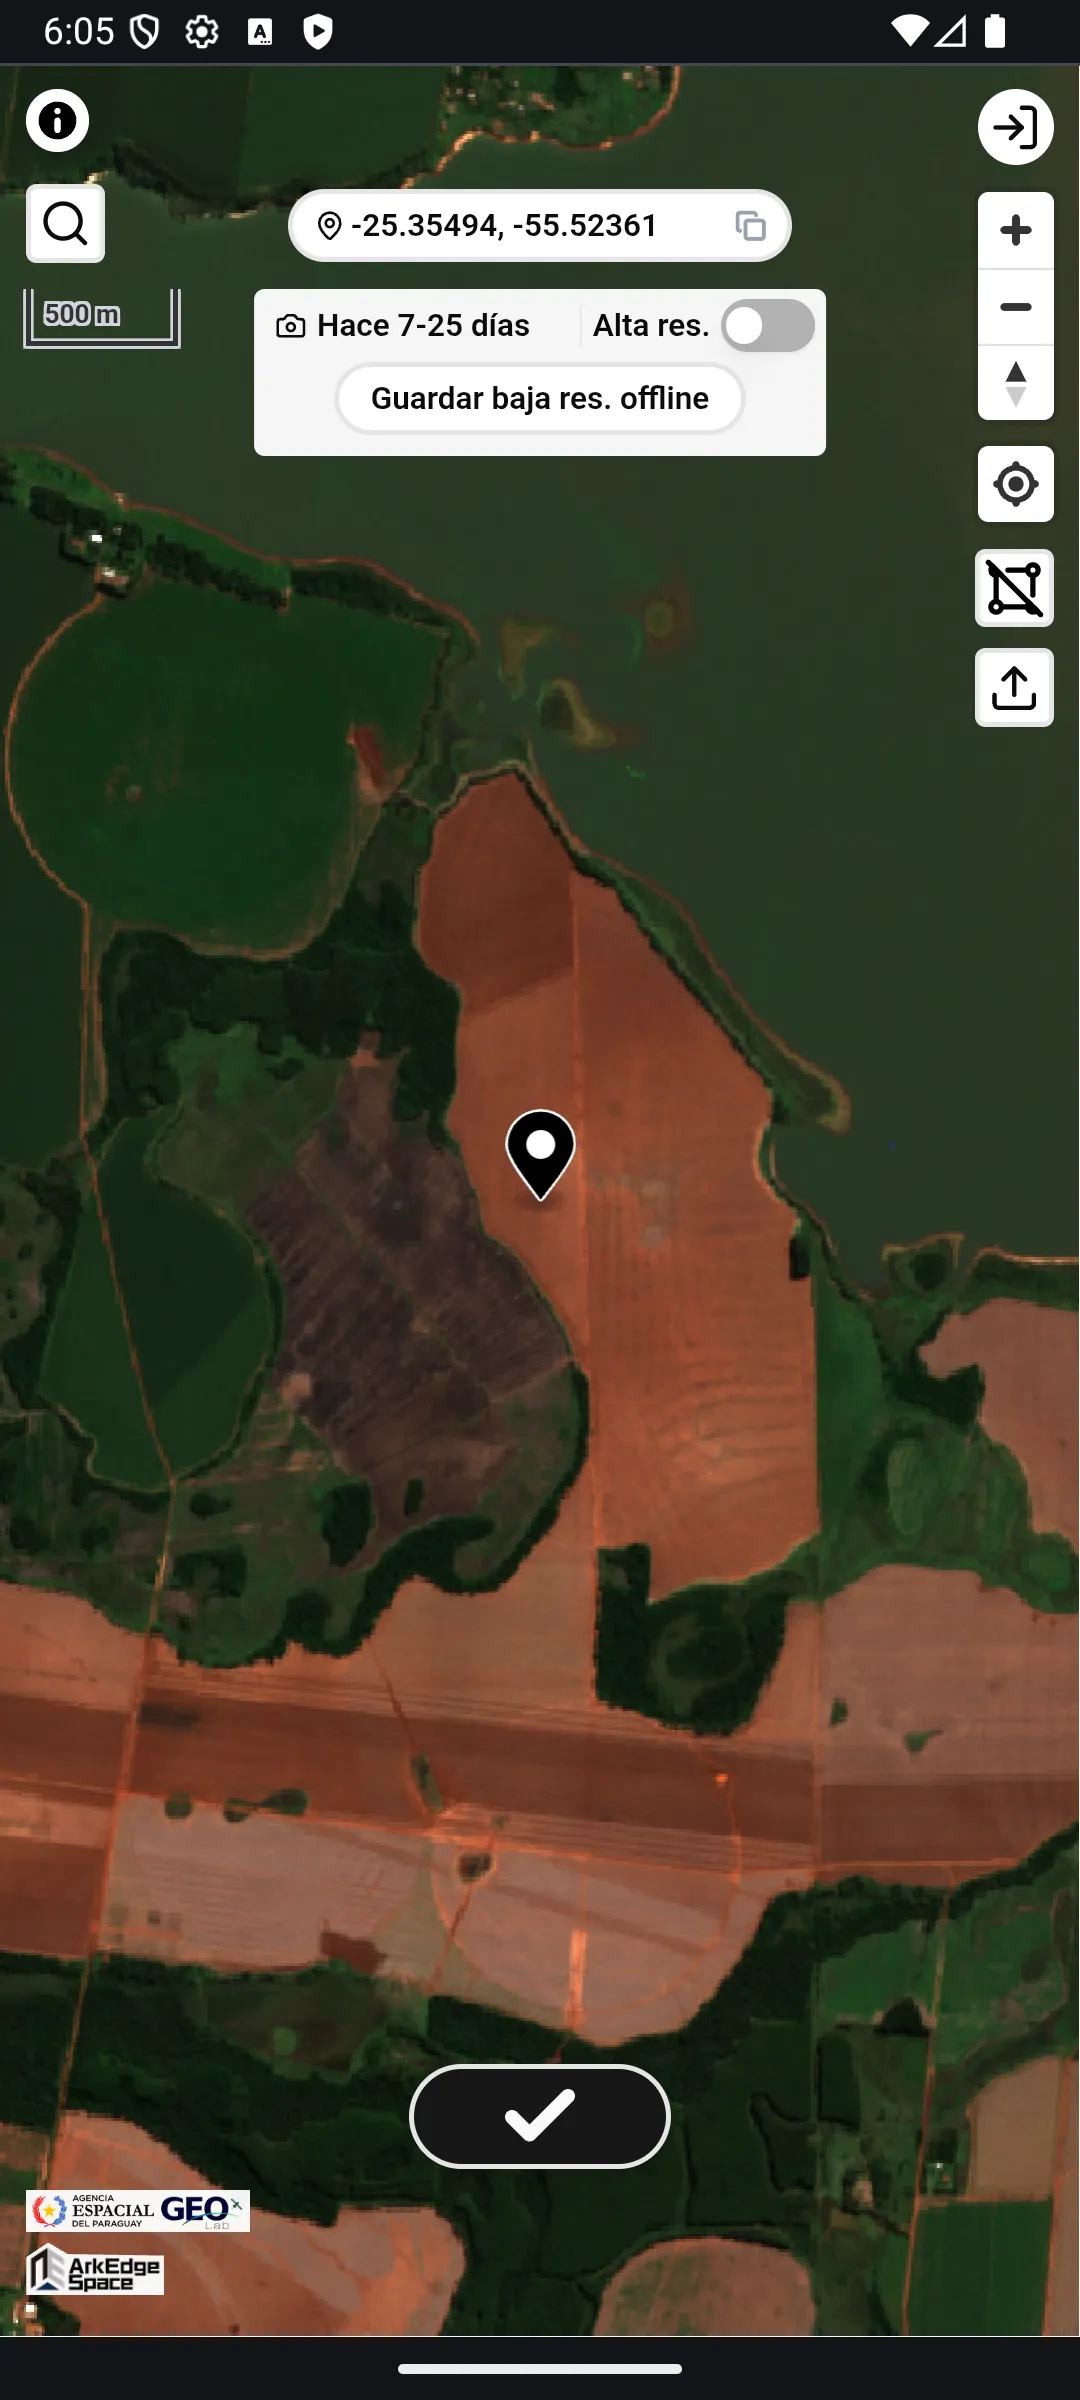
- Tap the check button at the bottom of the screen.
- A farmland polygon is automatically generated based on the selected location. The auto-generated polygon is labeled with an
Auto-detectedbadge. - If you tap the check button at a location where farmland polygon data already exists, that polygon is used instead.
- A farmland polygon is automatically generated based on the selected location. The auto-generated polygon is labeled with an
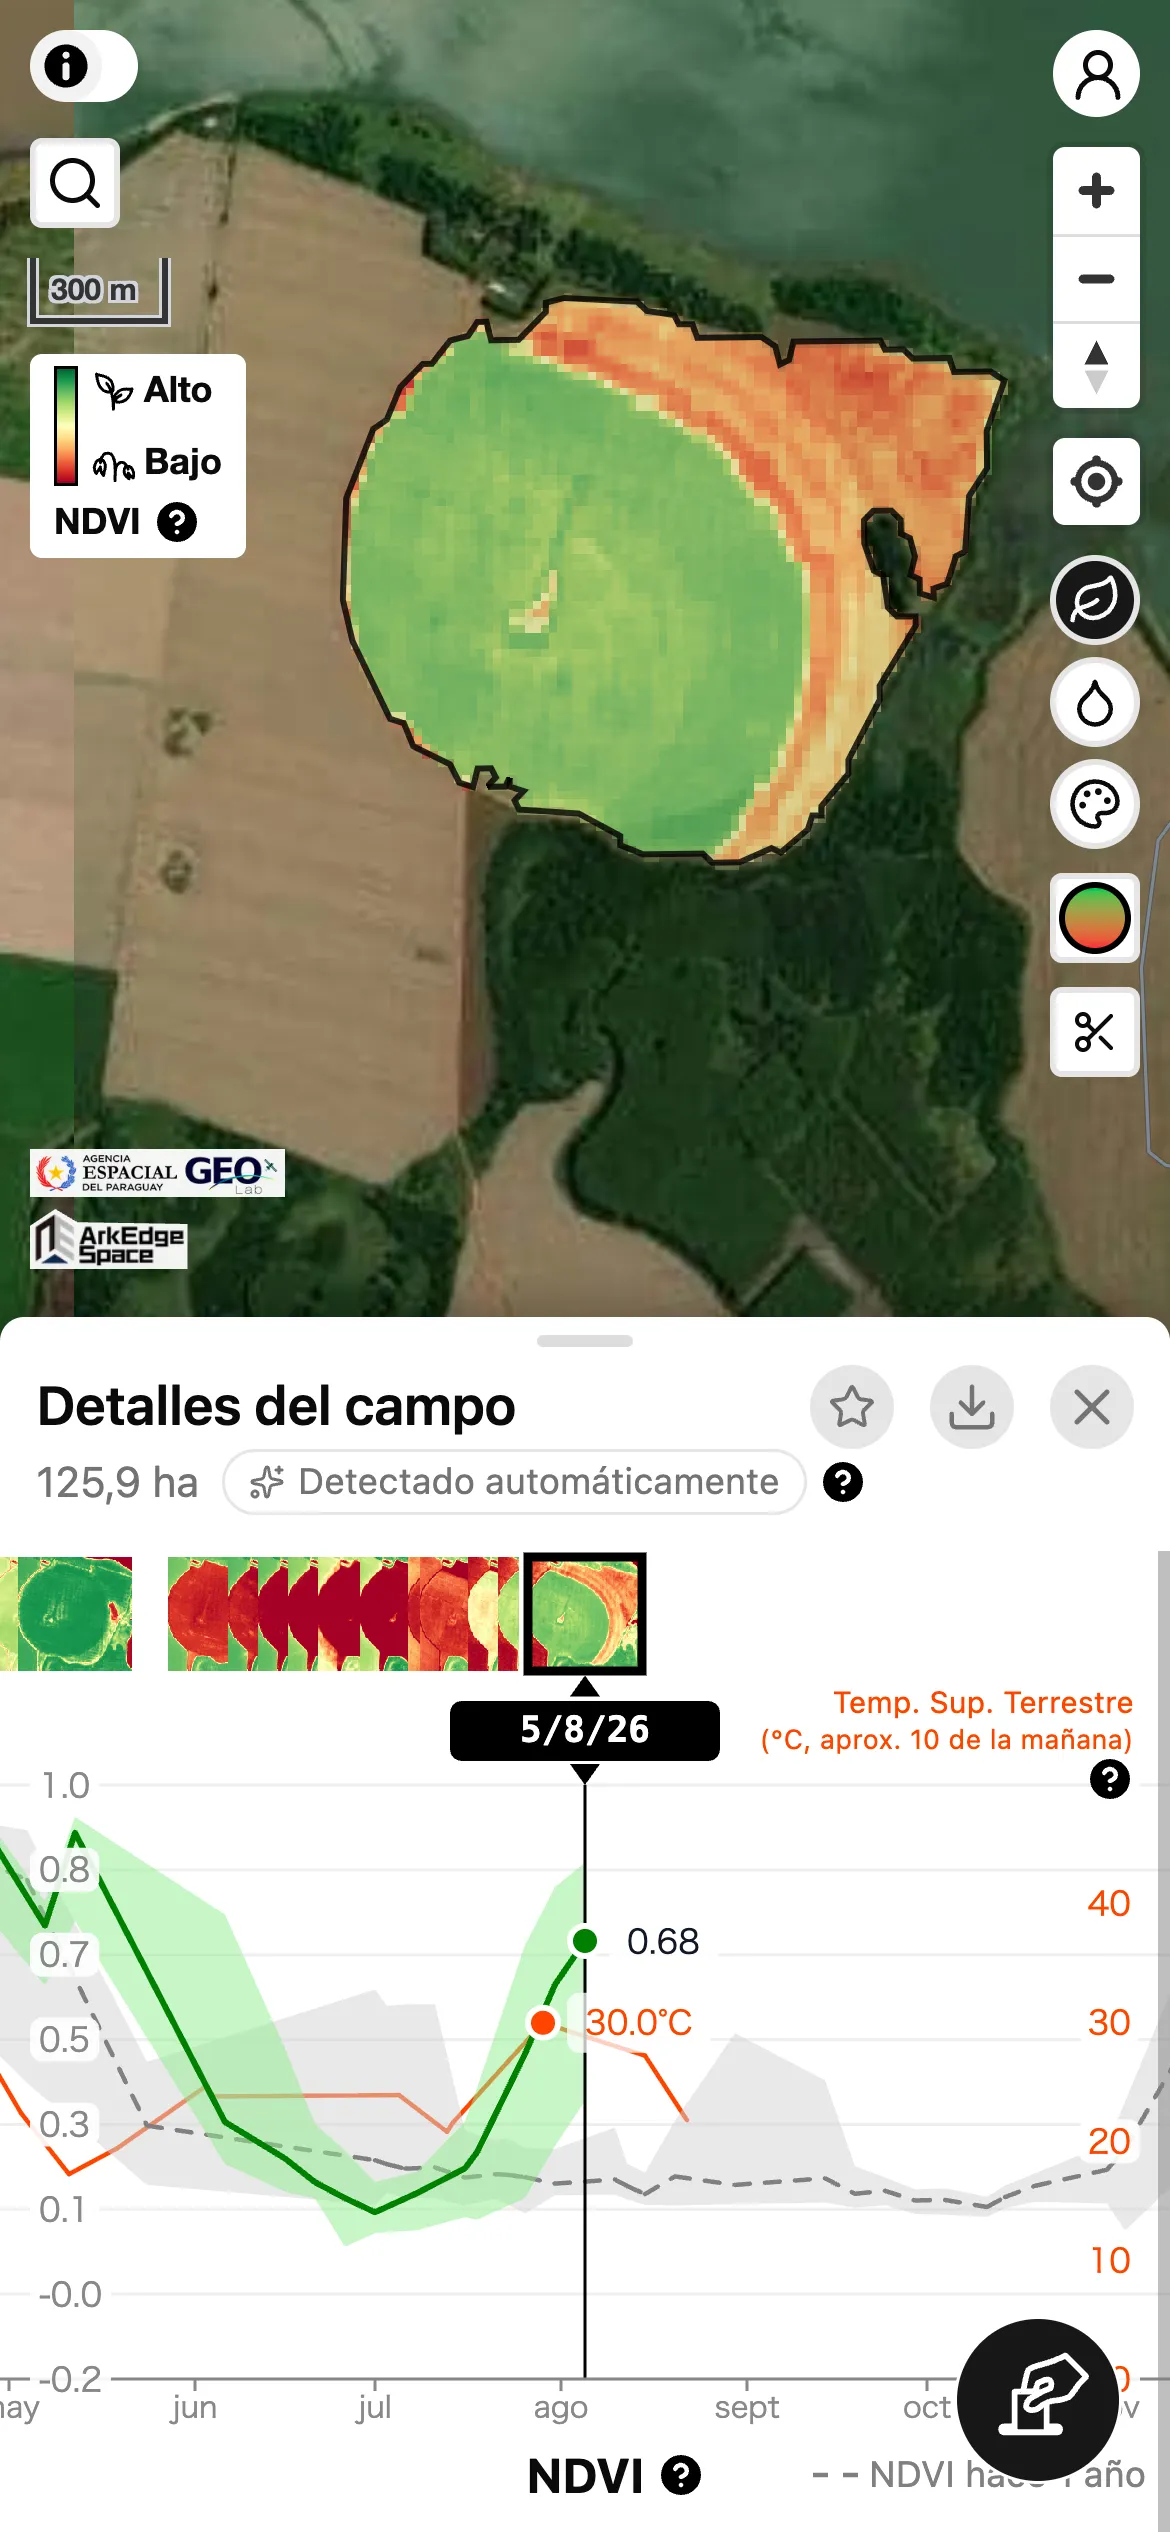
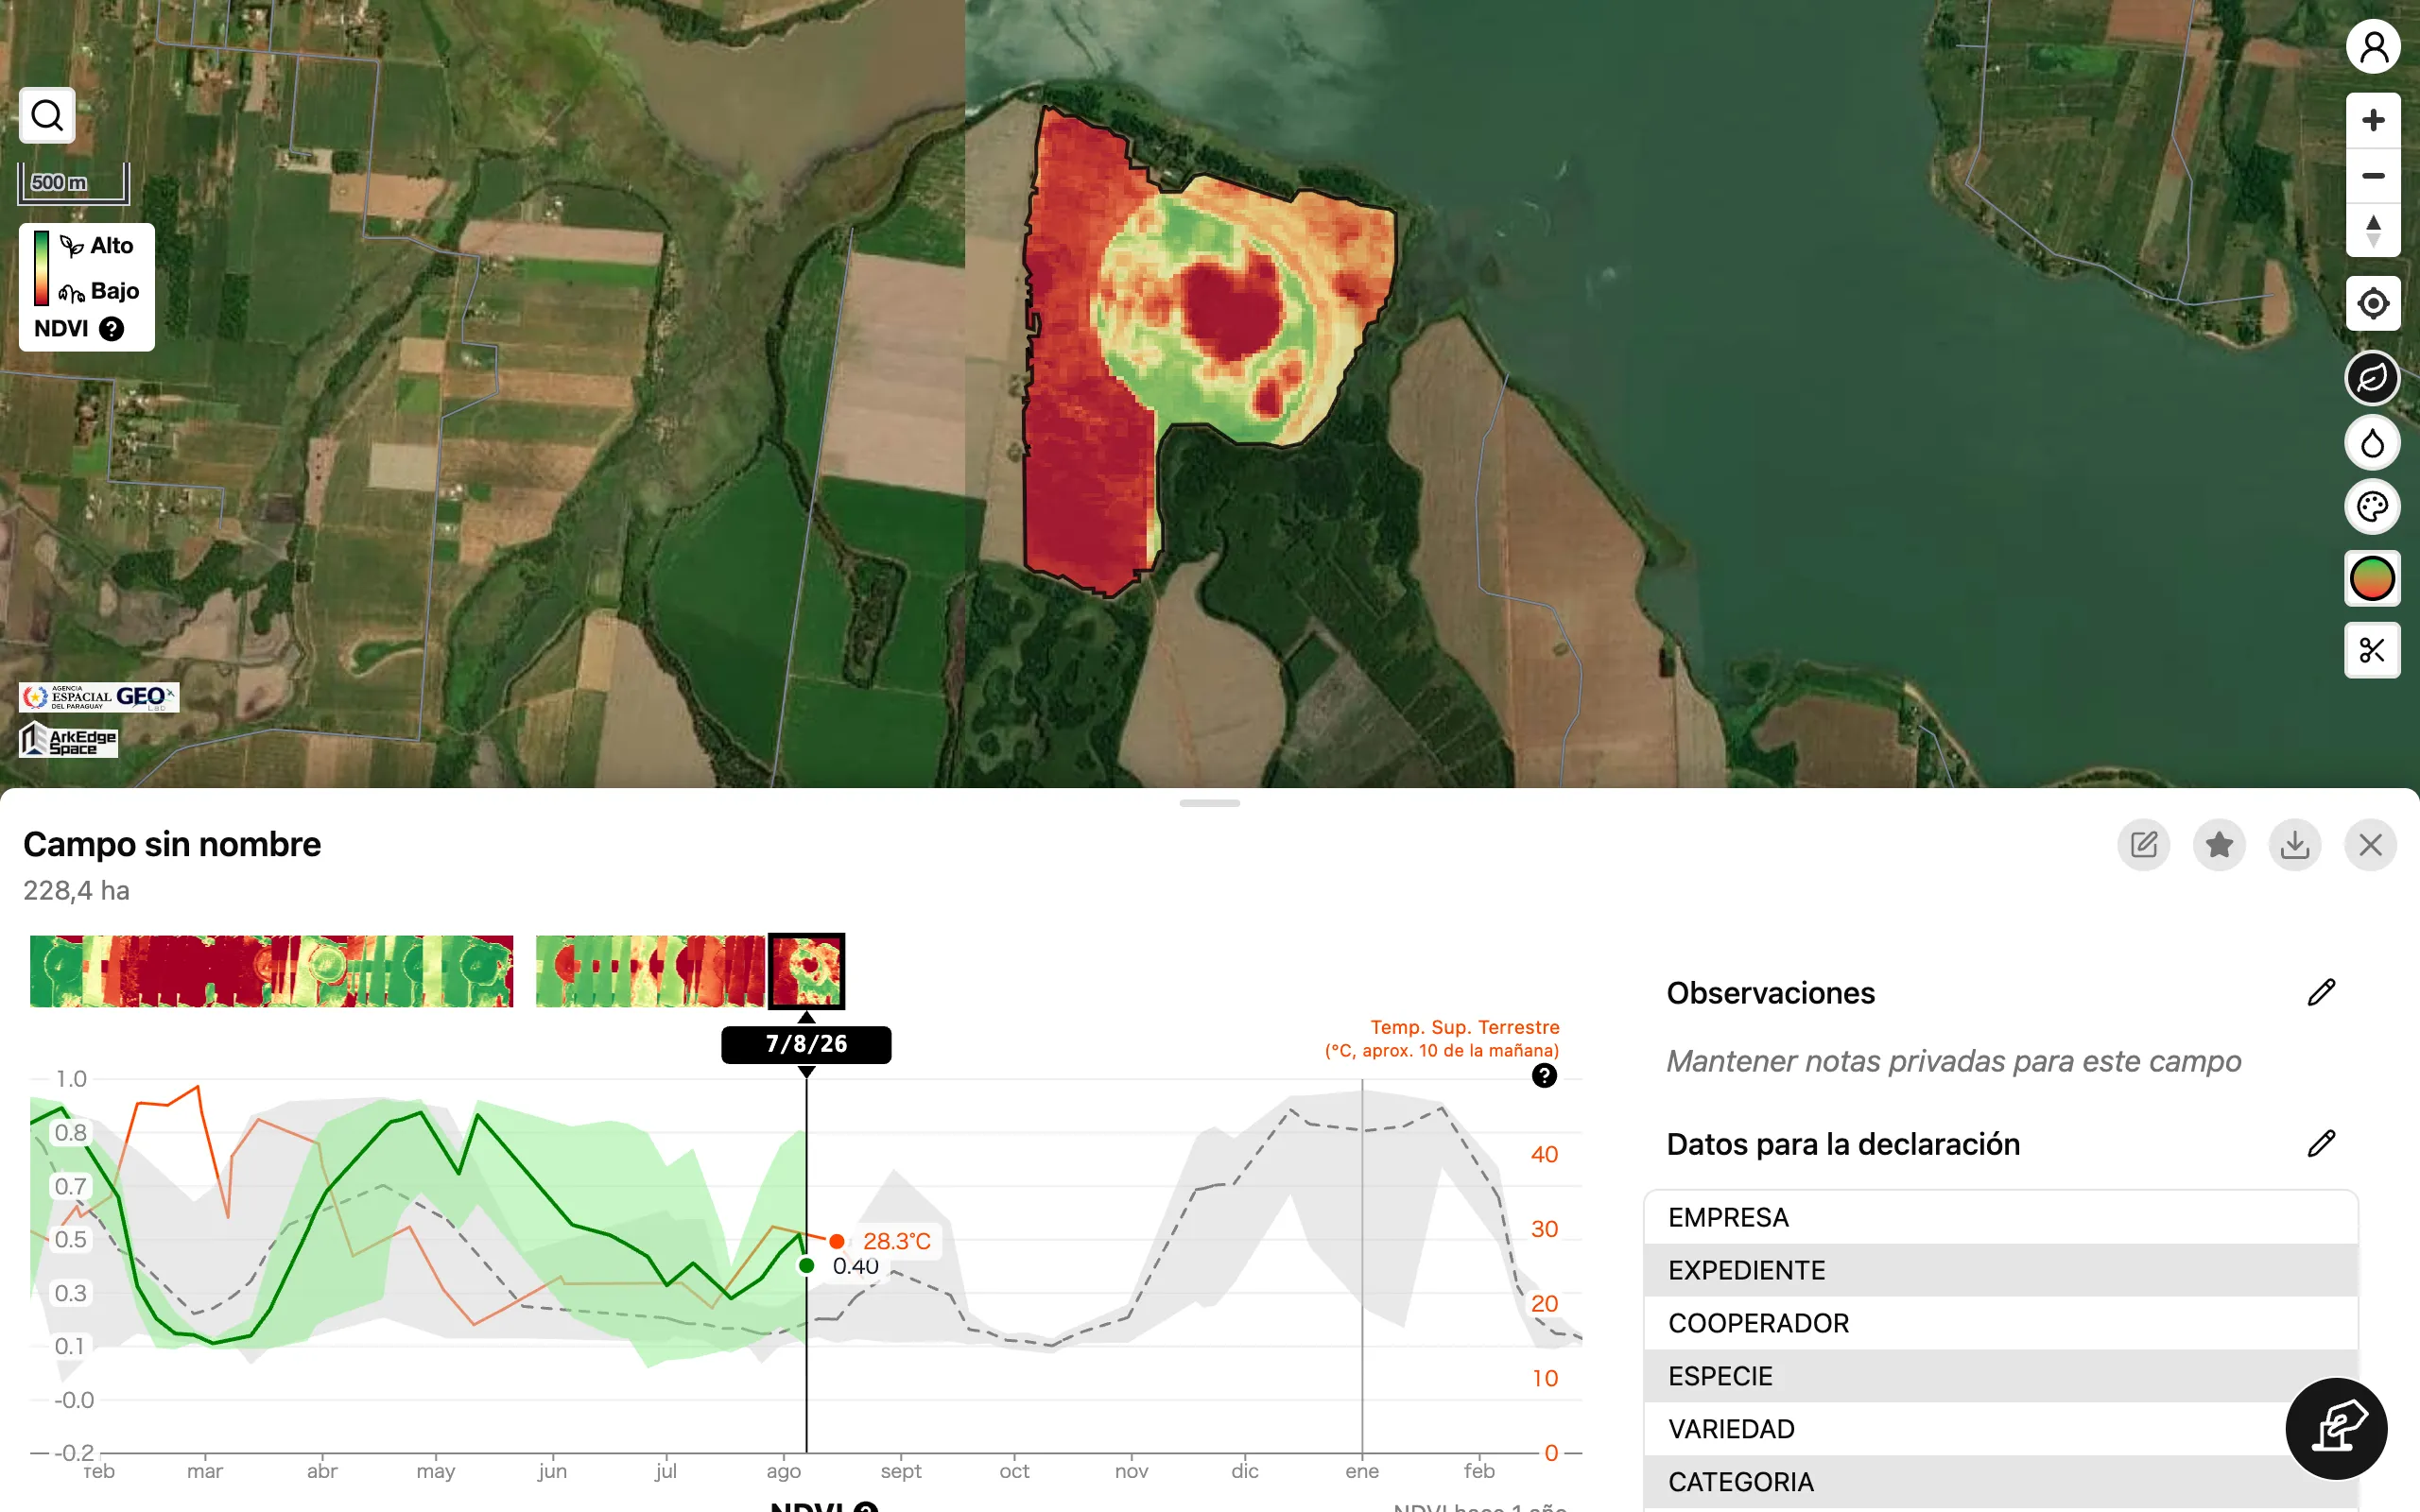
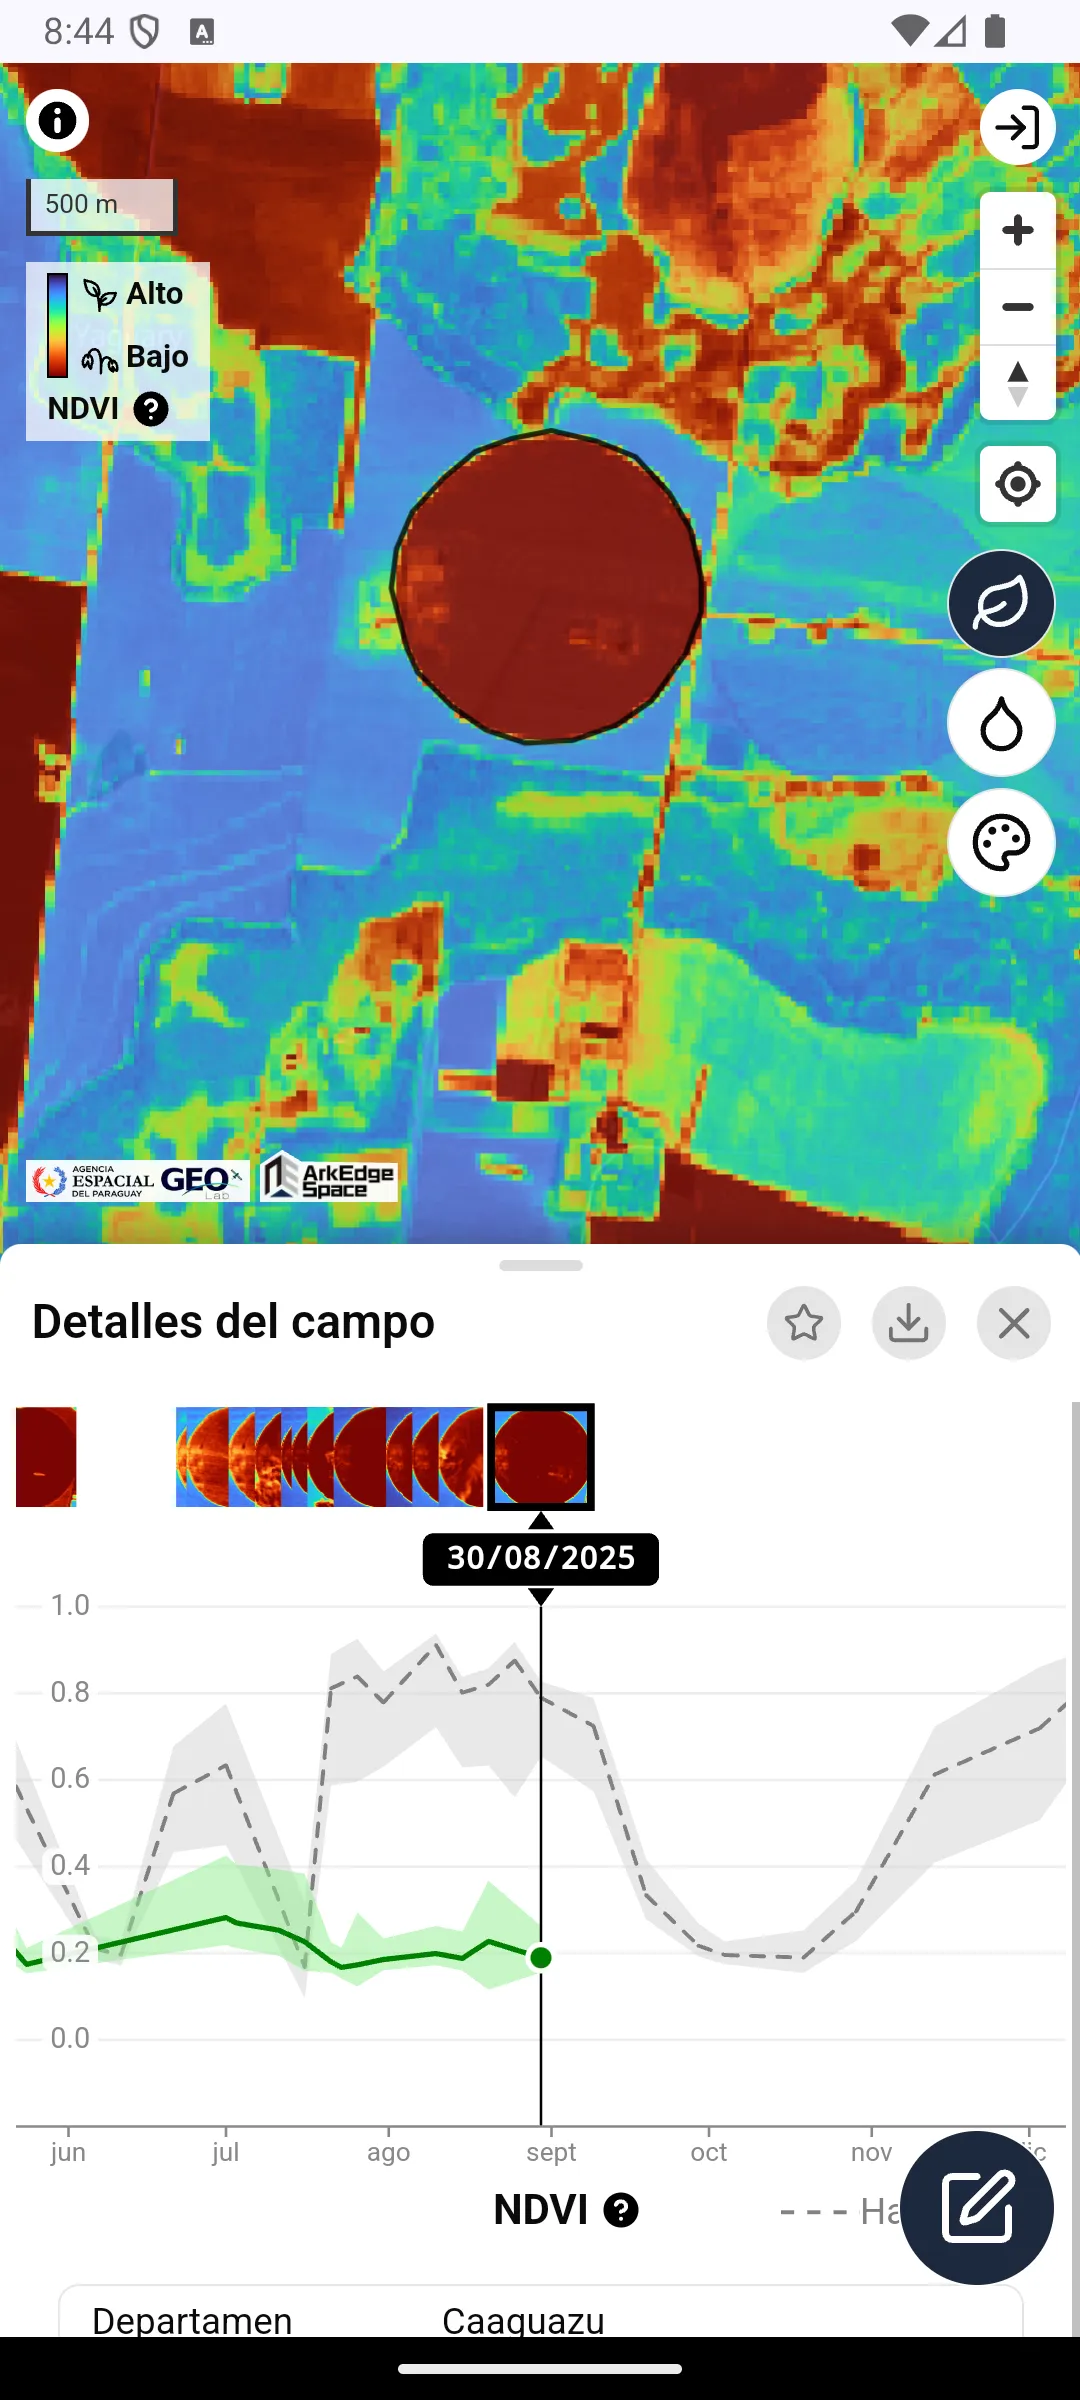
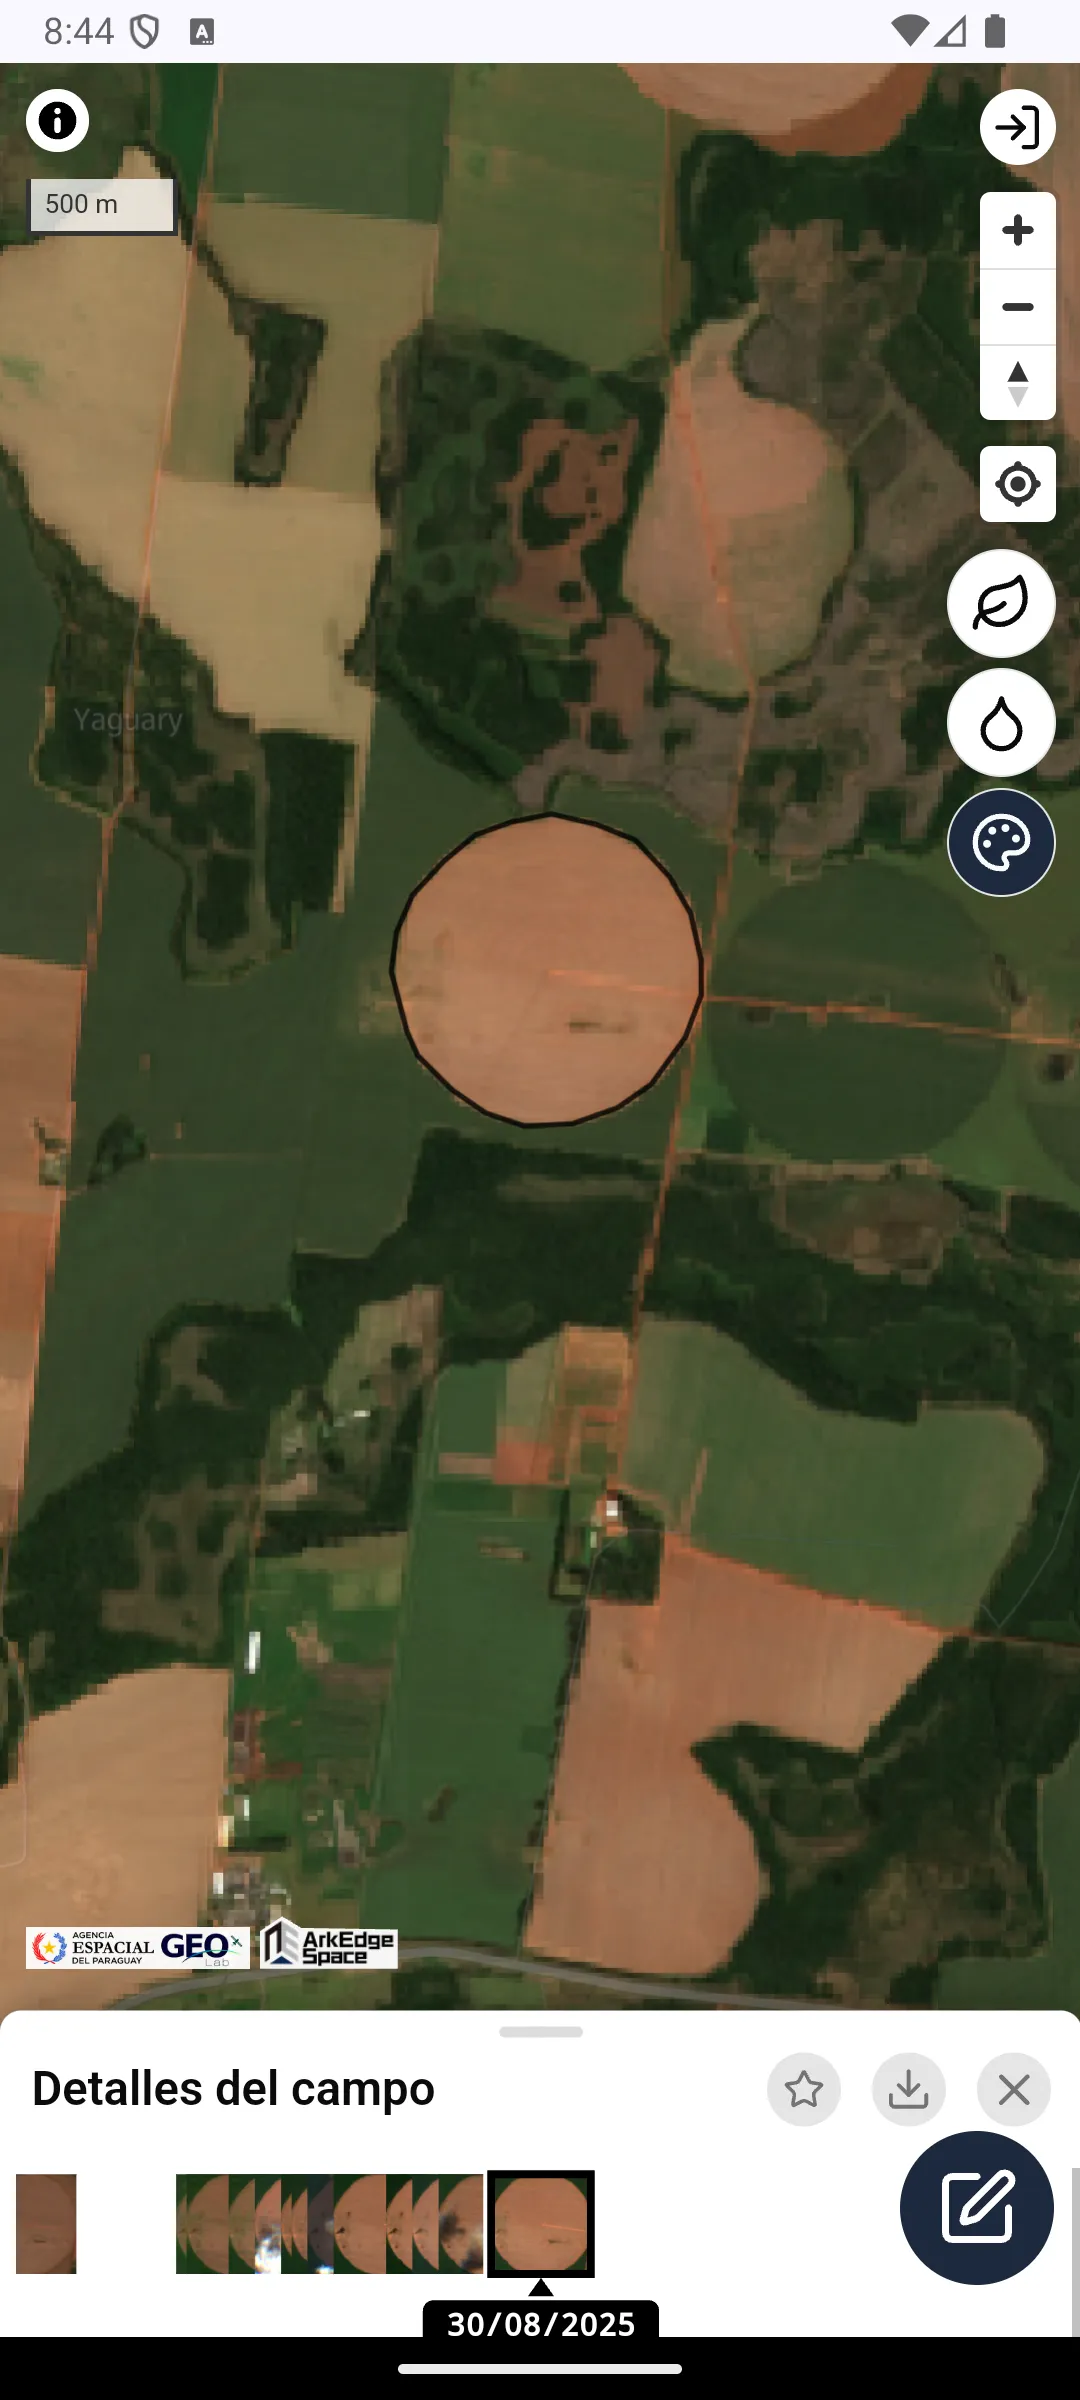
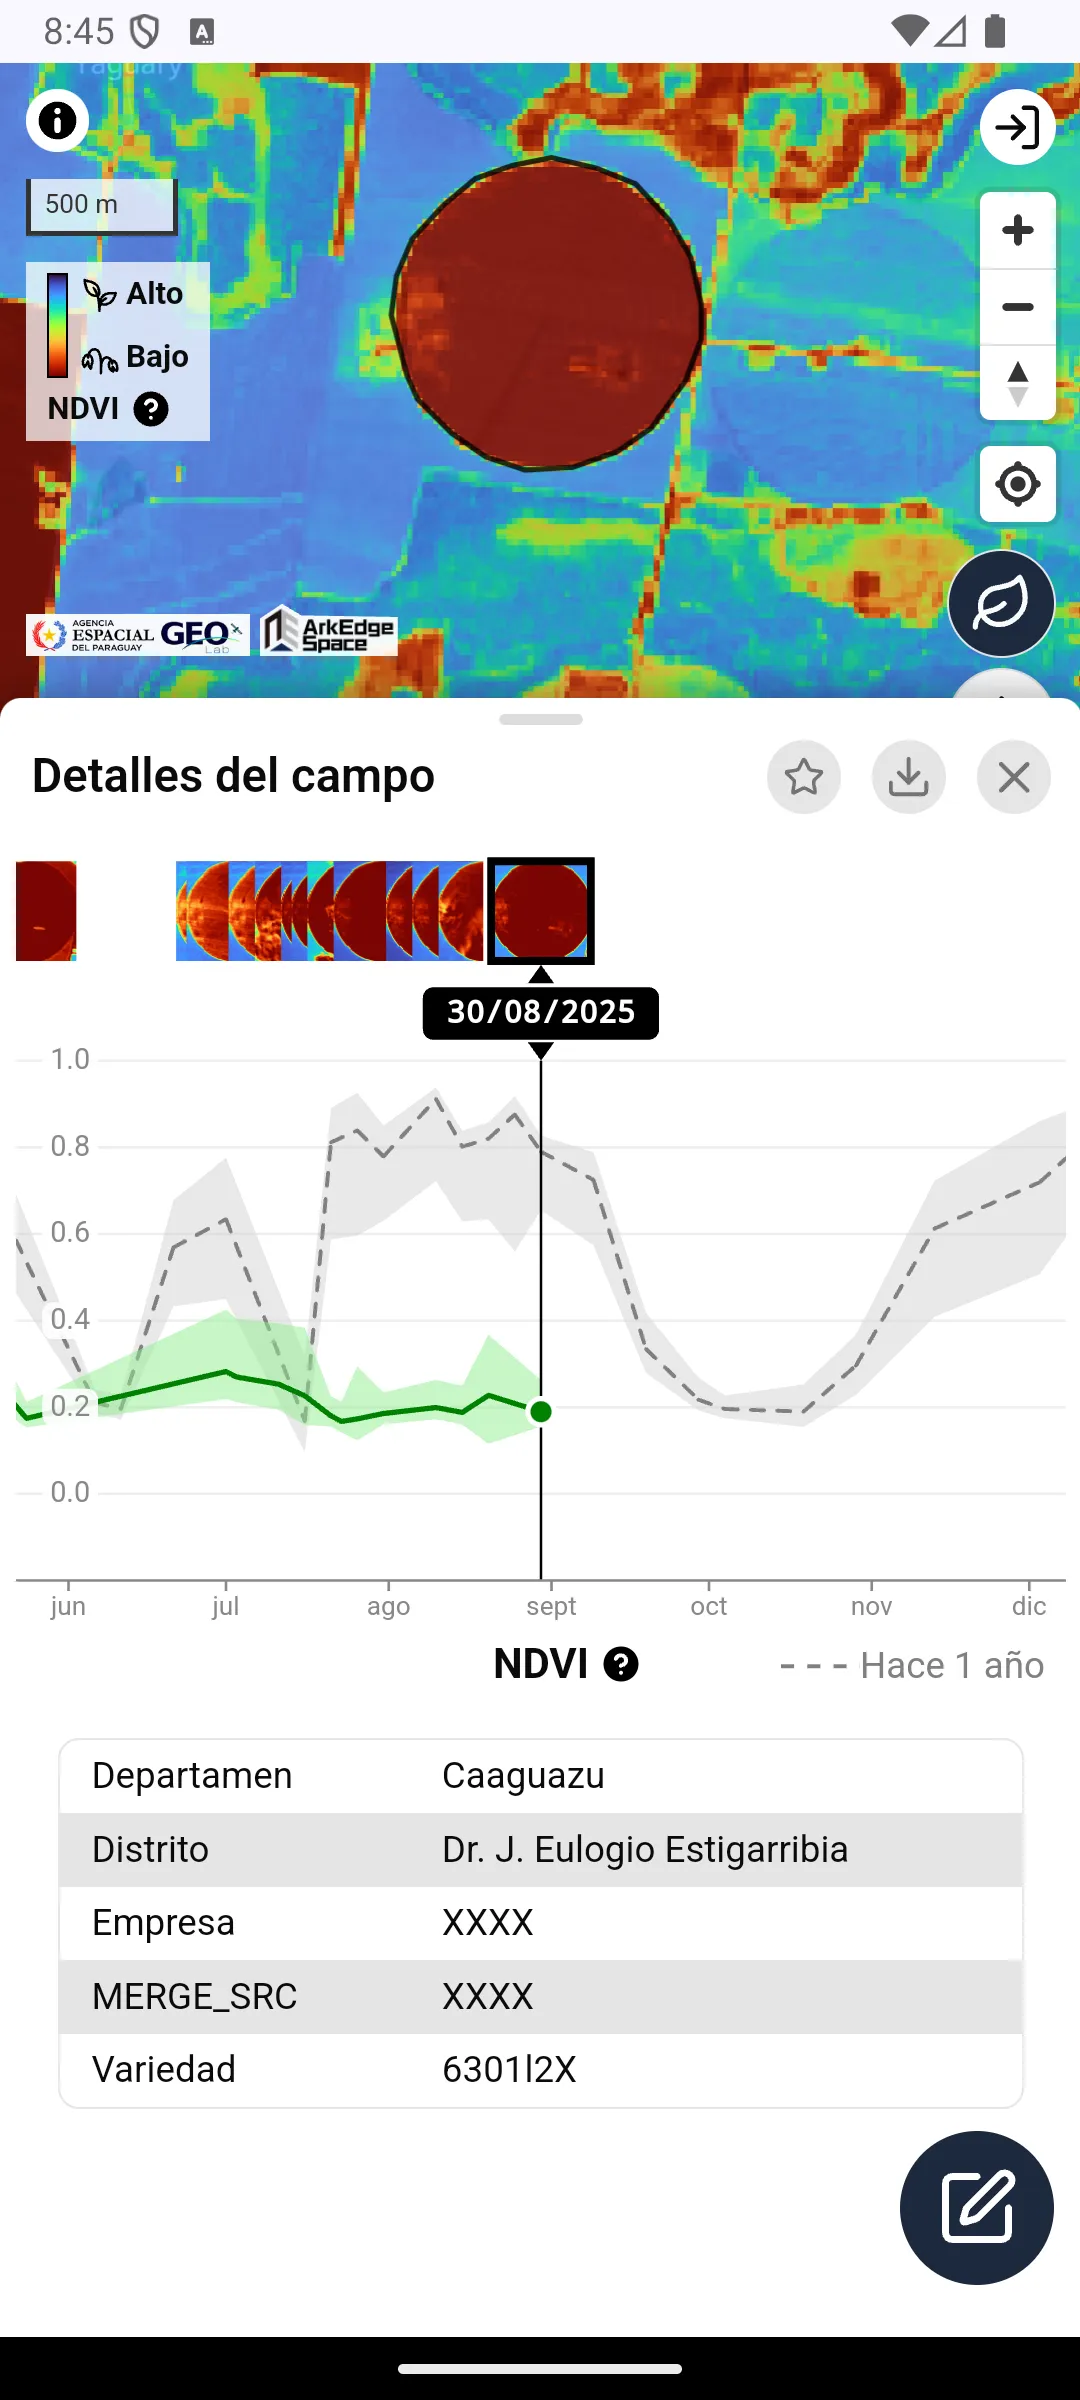
- View the analysis results of time-series satellite data for the selected farmland area.
- If attribute data exists for the selected farmland polygon, it will be displayed below the time series graph.
- Tap the X button on the bottom panel to deselect the farmland polygon.
Detailed Usage
Section titled “Detailed Usage”Background Imagery
Section titled “Background Imagery”The toggle at the top of the screen switches between the high-resolution base map (Hi-Res) and the low-resolution satellite background imagery (Lo-Res).
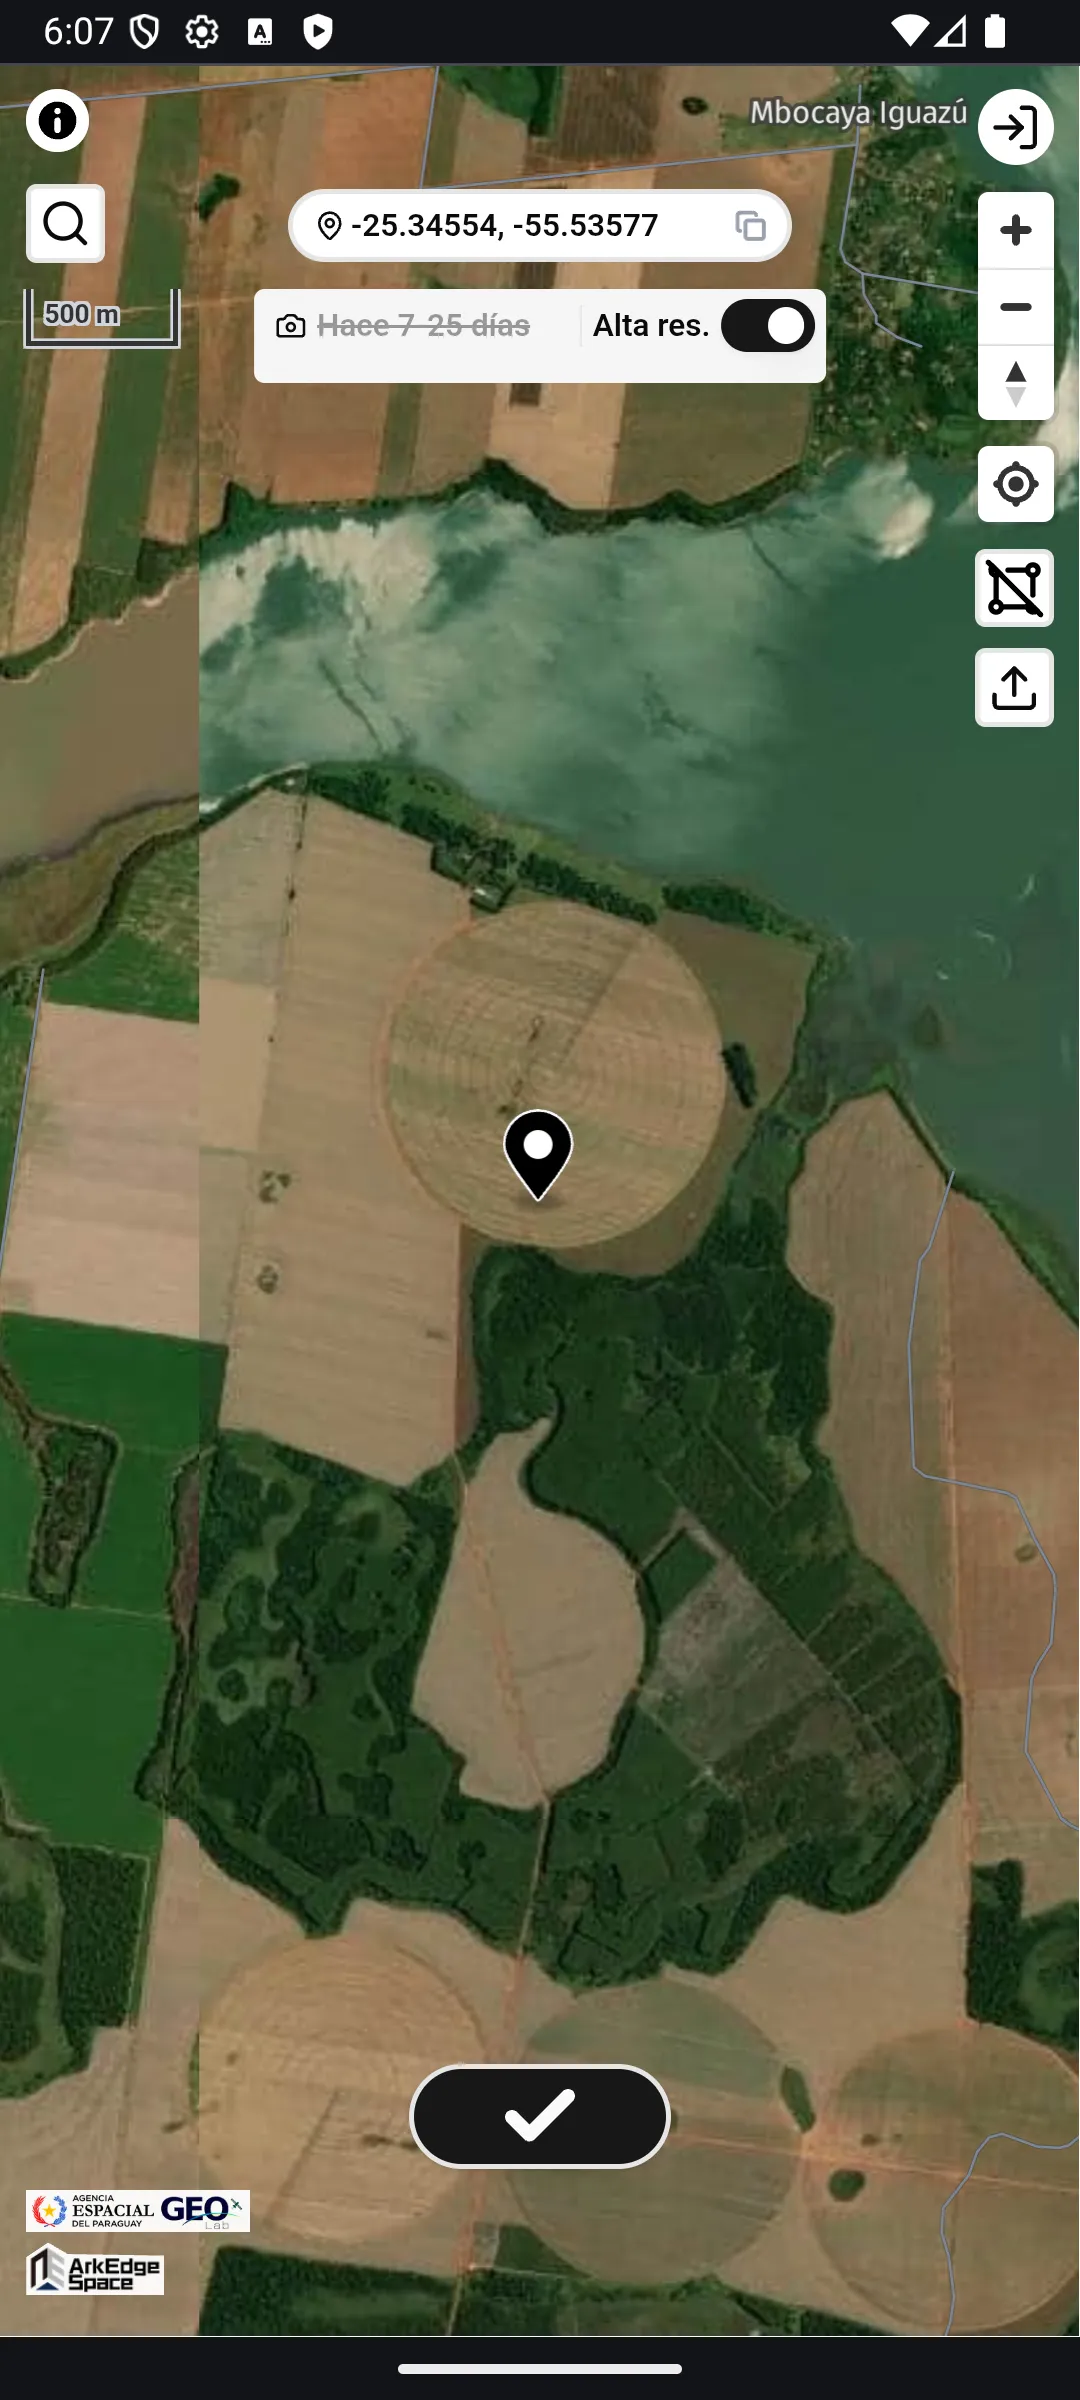
The date shown on the left indicates the approximate capture date of the Lo-Res background imagery used for the area you are currently viewing.
When imagery from multiple dates is used, a range like 7-25 days ago is shown instead.
For locations or zoom levels where Lo-Res background imagery is not available, the map automatically switches to Hi-Res.
In this case, No image available is shown and you cannot switch to Lo-Res.
Department and District Boundaries
Section titled “Department and District Boundaries”The map shows the boundaries and names of Paraguay’s departments (Departamento) and districts (Distrito). Use them to check which department and district a submitted field polygon falls in. Department boundaries are drawn as solid lines and district boundaries as dotted lines. As you zoom in, district boundaries appear and the labels change from department names to district names.
The boundary data is the “Cartografía Censal 2022” from Paraguay’s National Institute of Statistics (INE). Tap the i button in the top left corner of the screen to see the attribution.
User Account
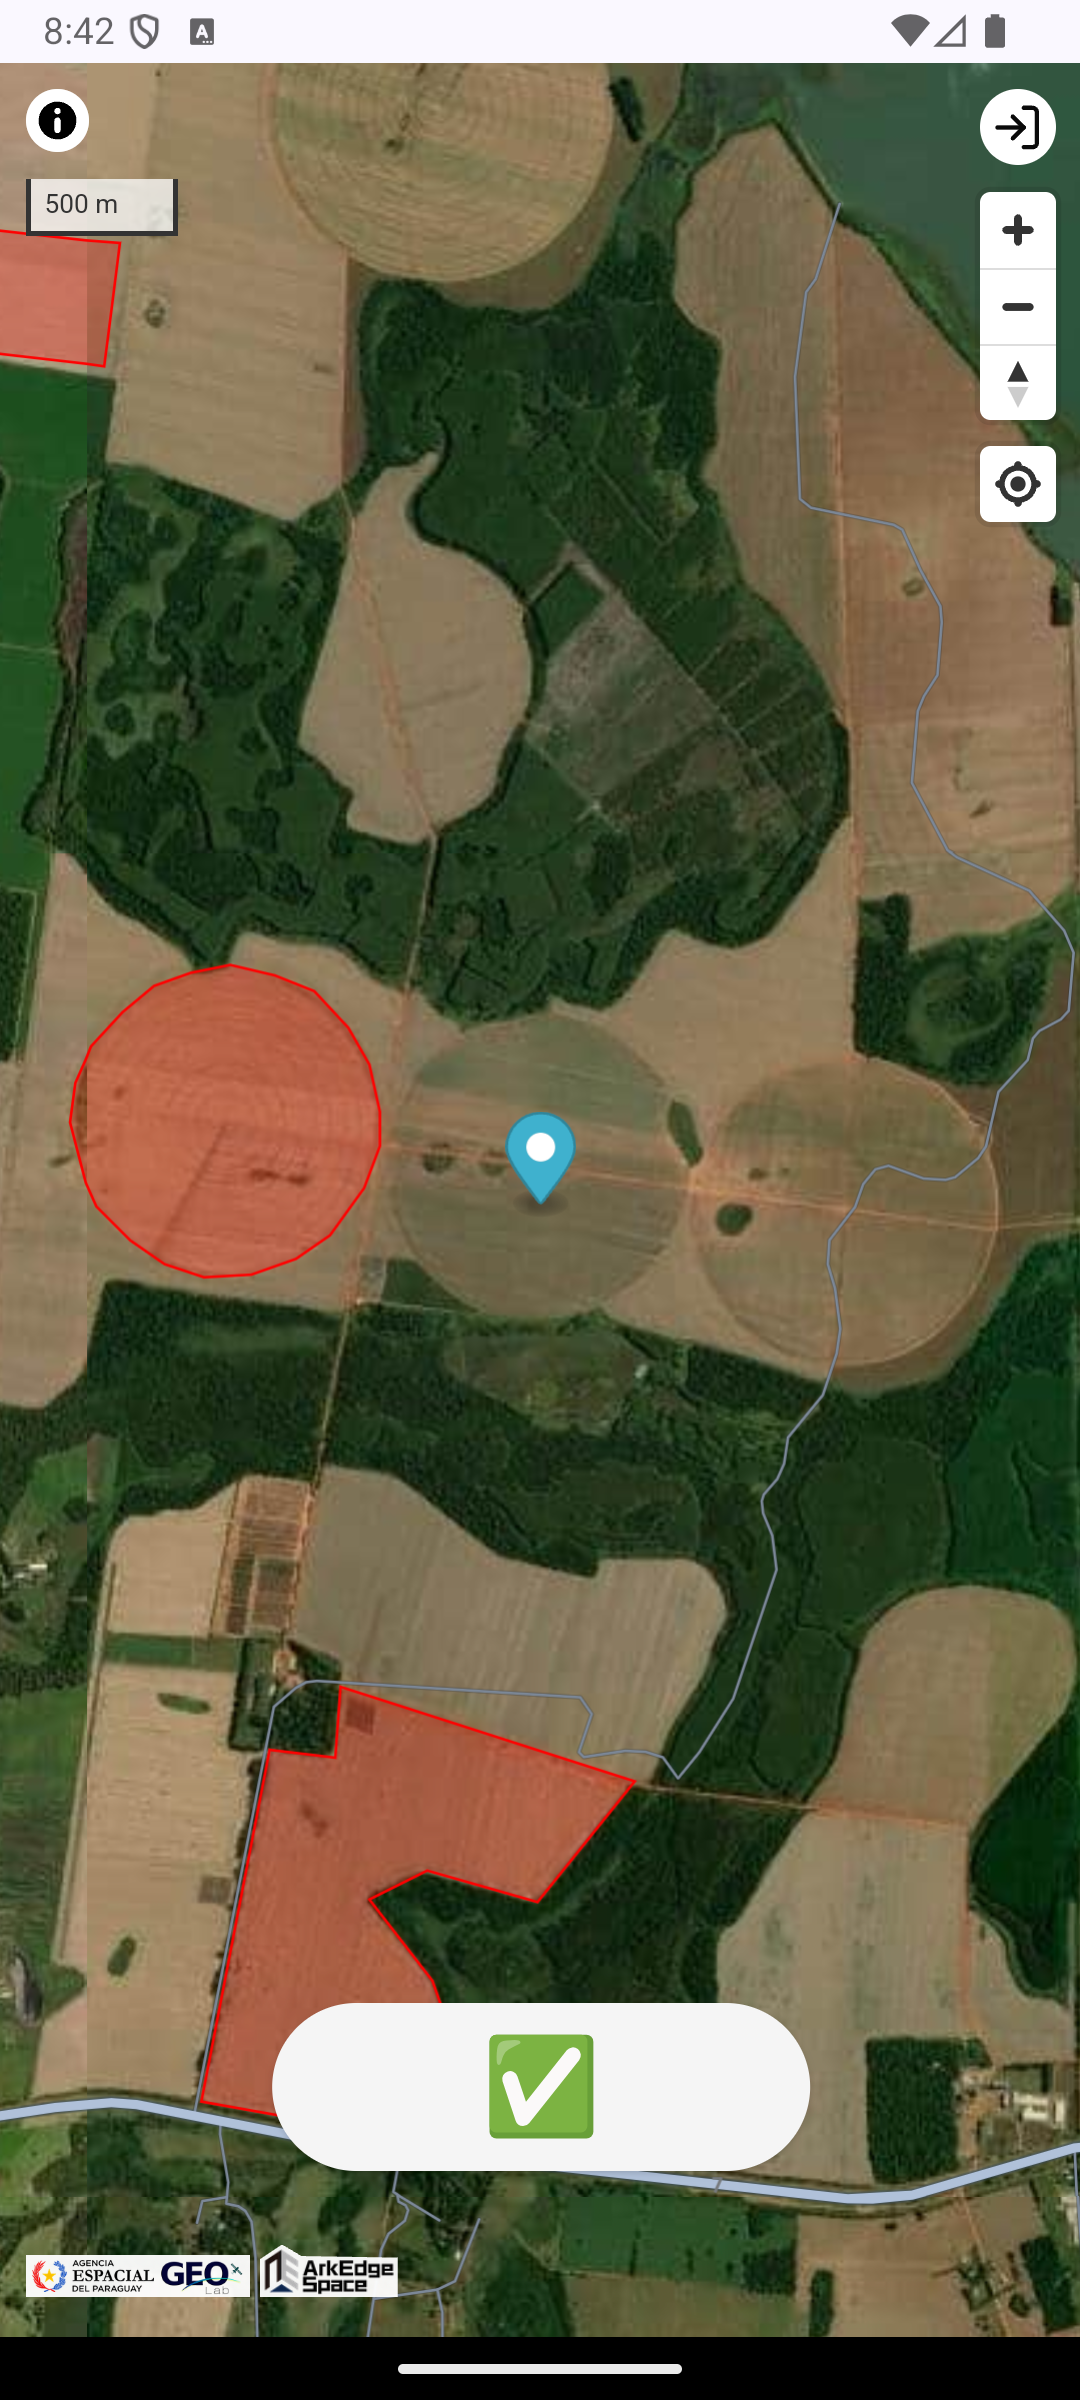
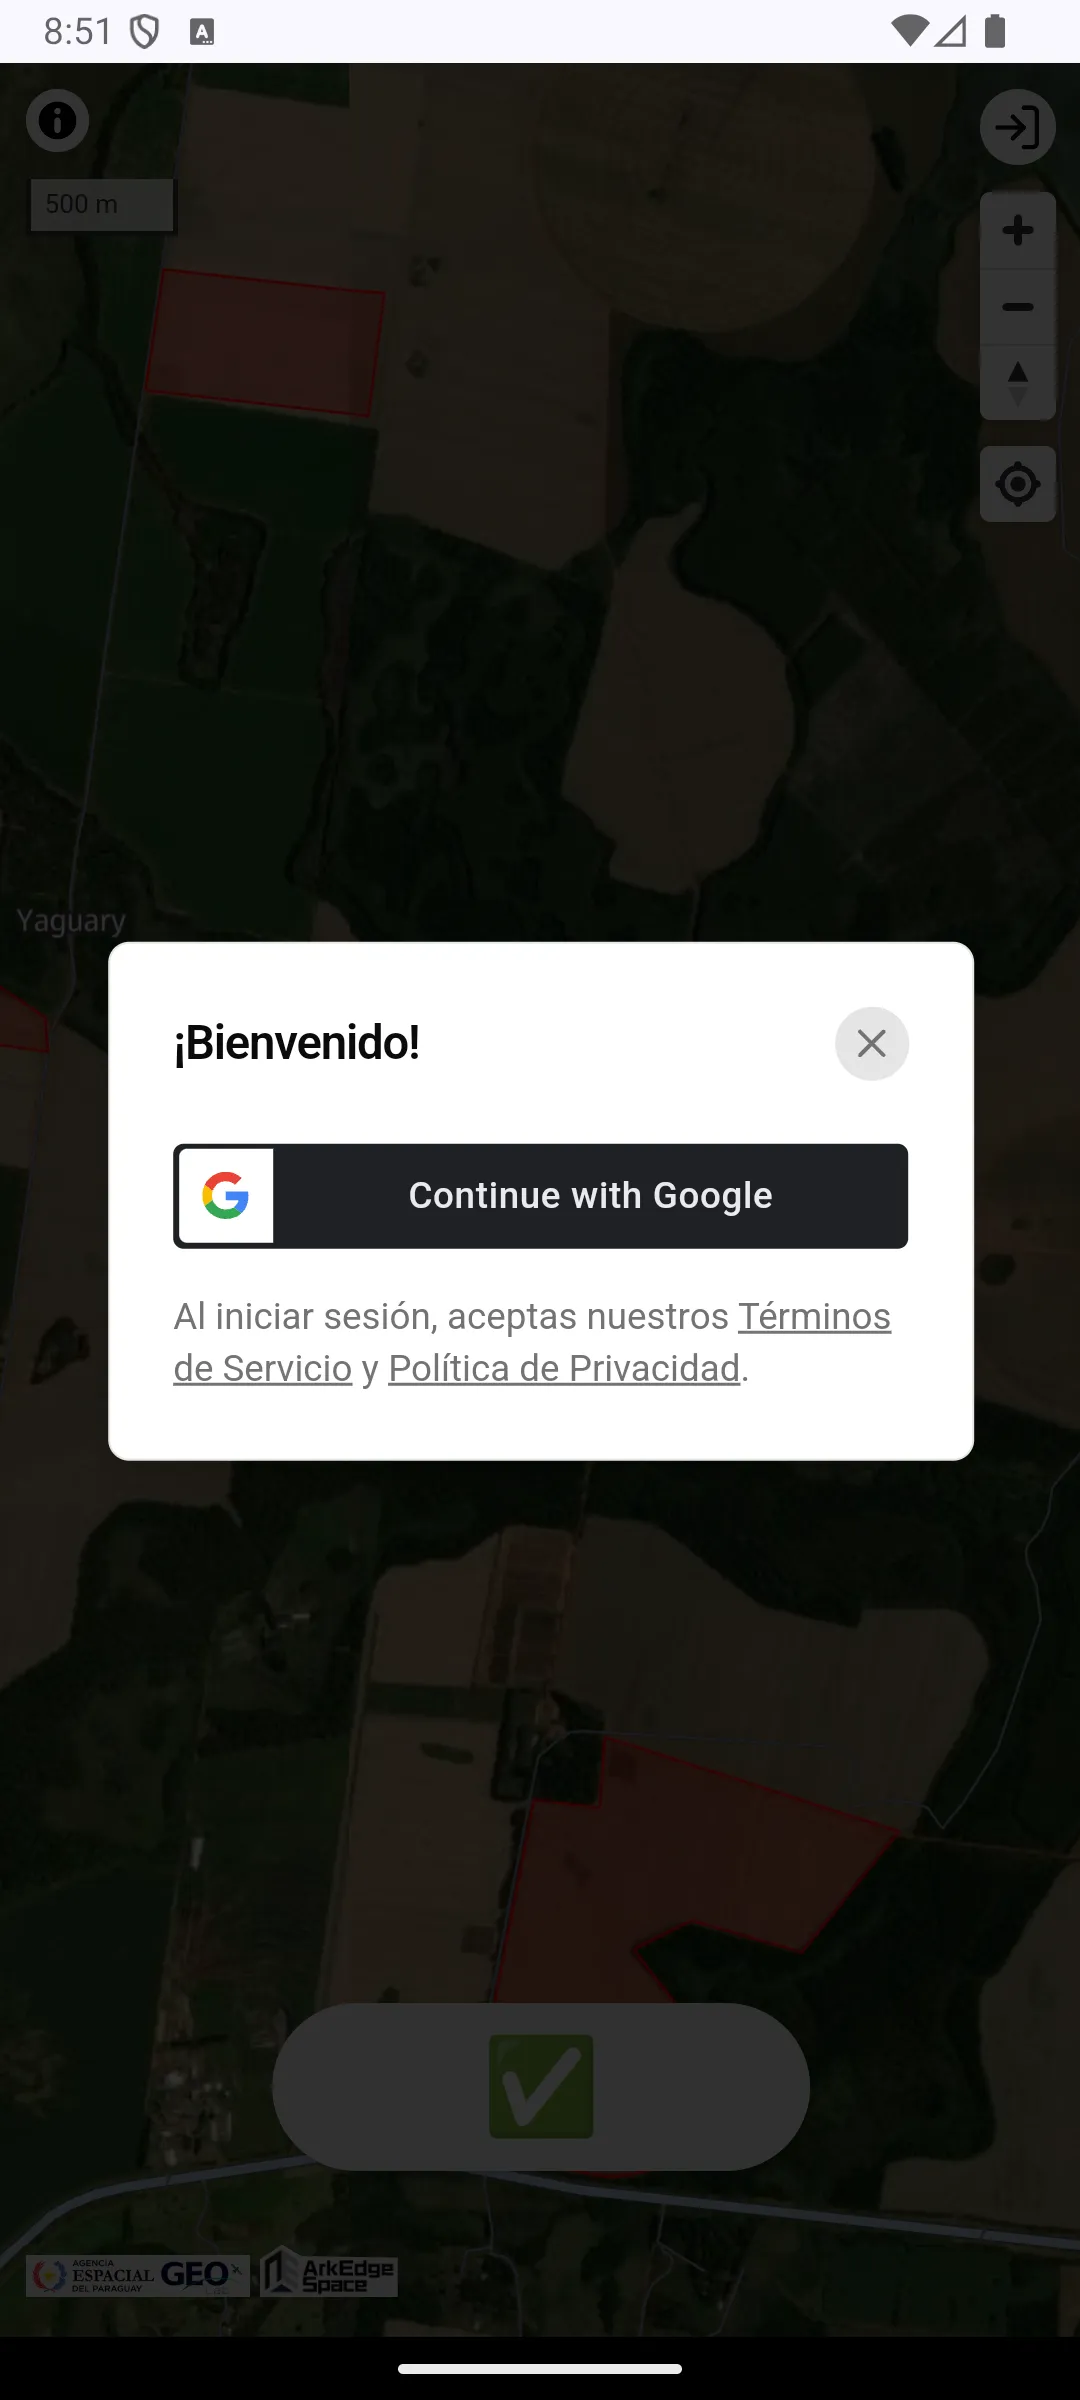
Section titled “User Account”Basic usage of the app does not require user registration or login. However, to use the bookmark feature or to enter the description and declaration data, you need to create a user account and log in.
Farmland Selection
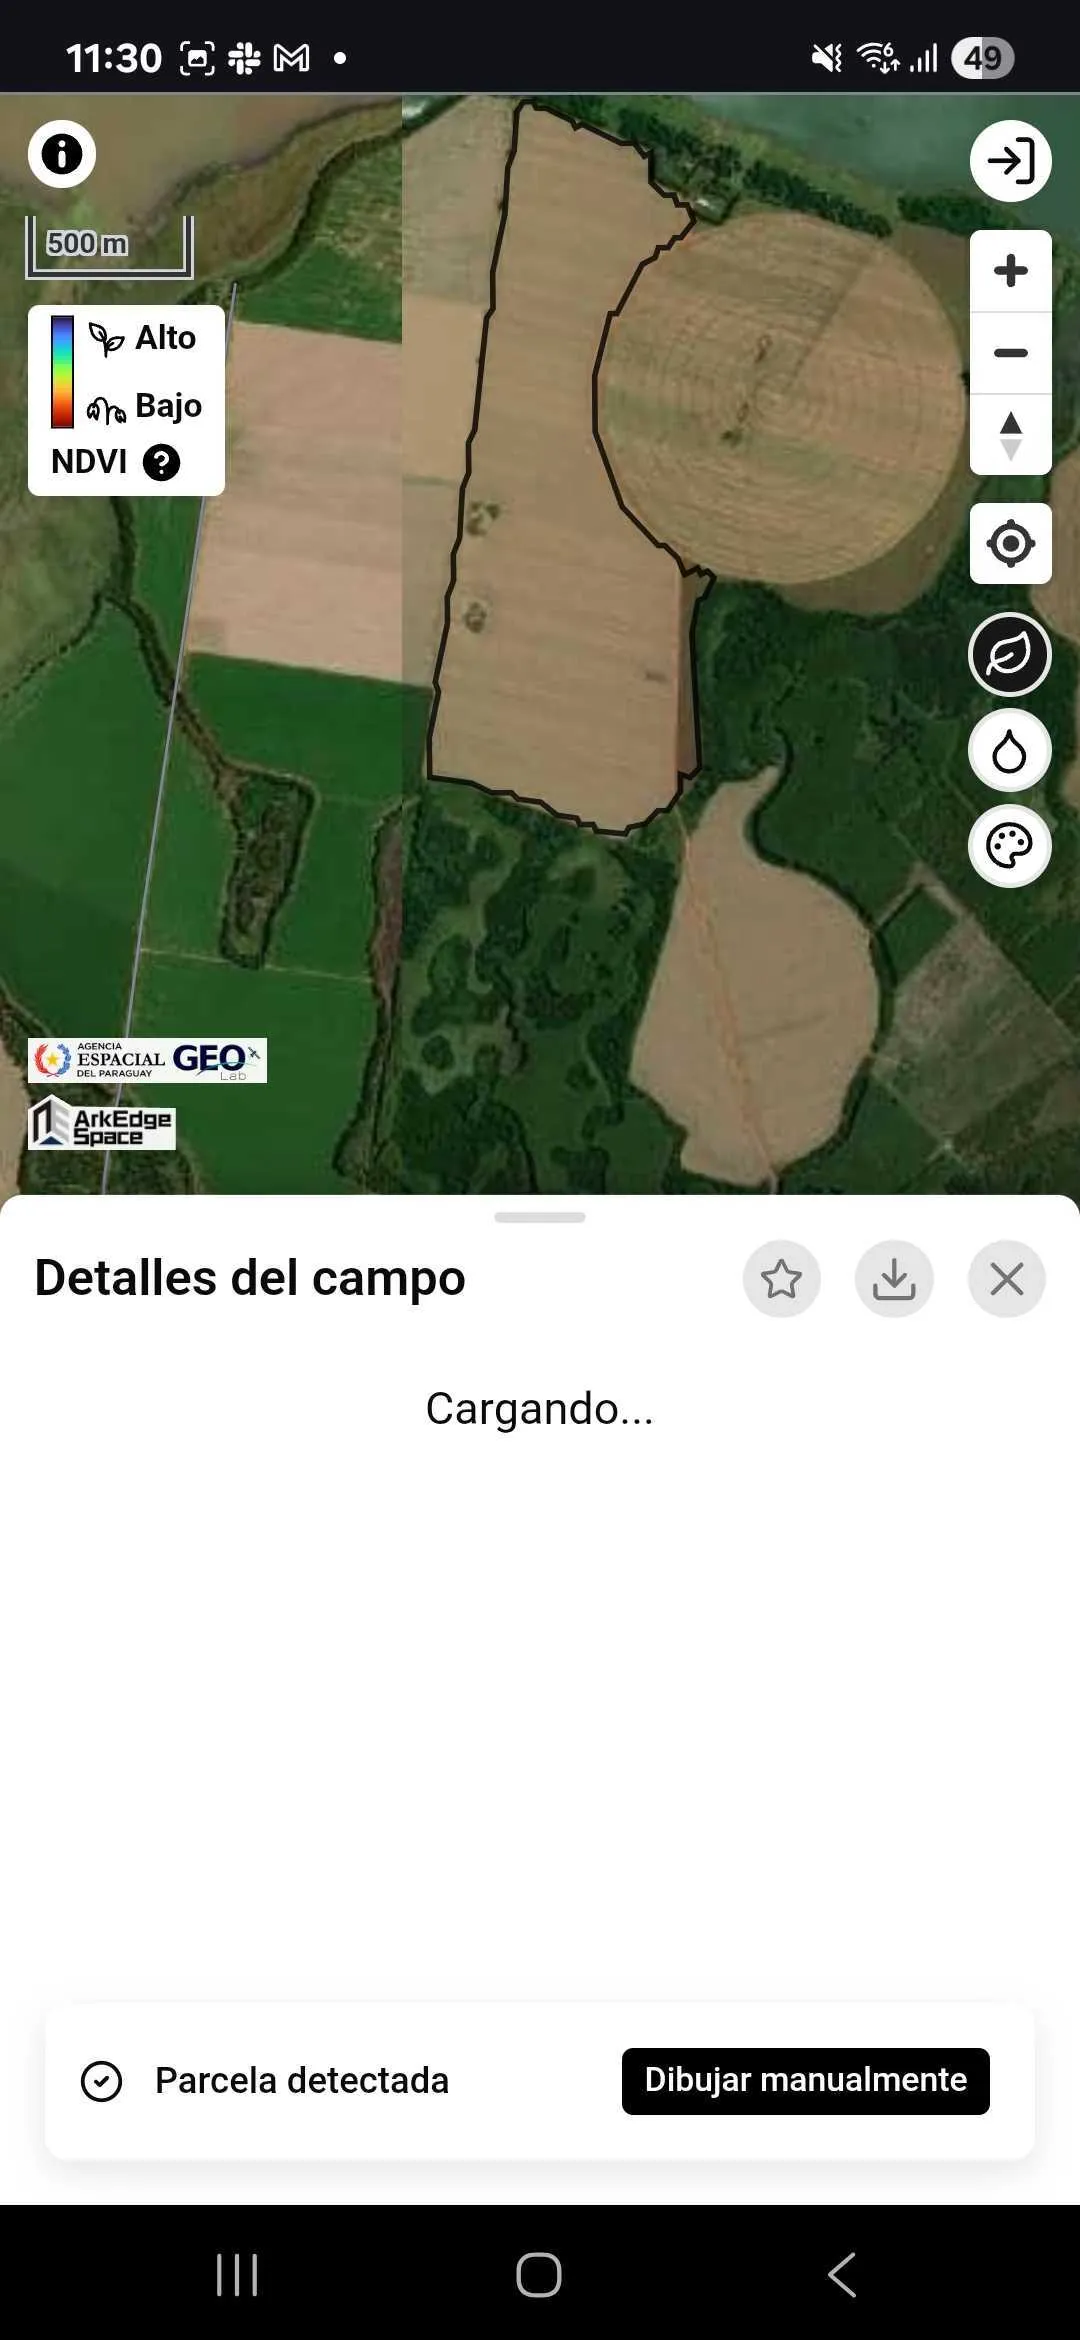
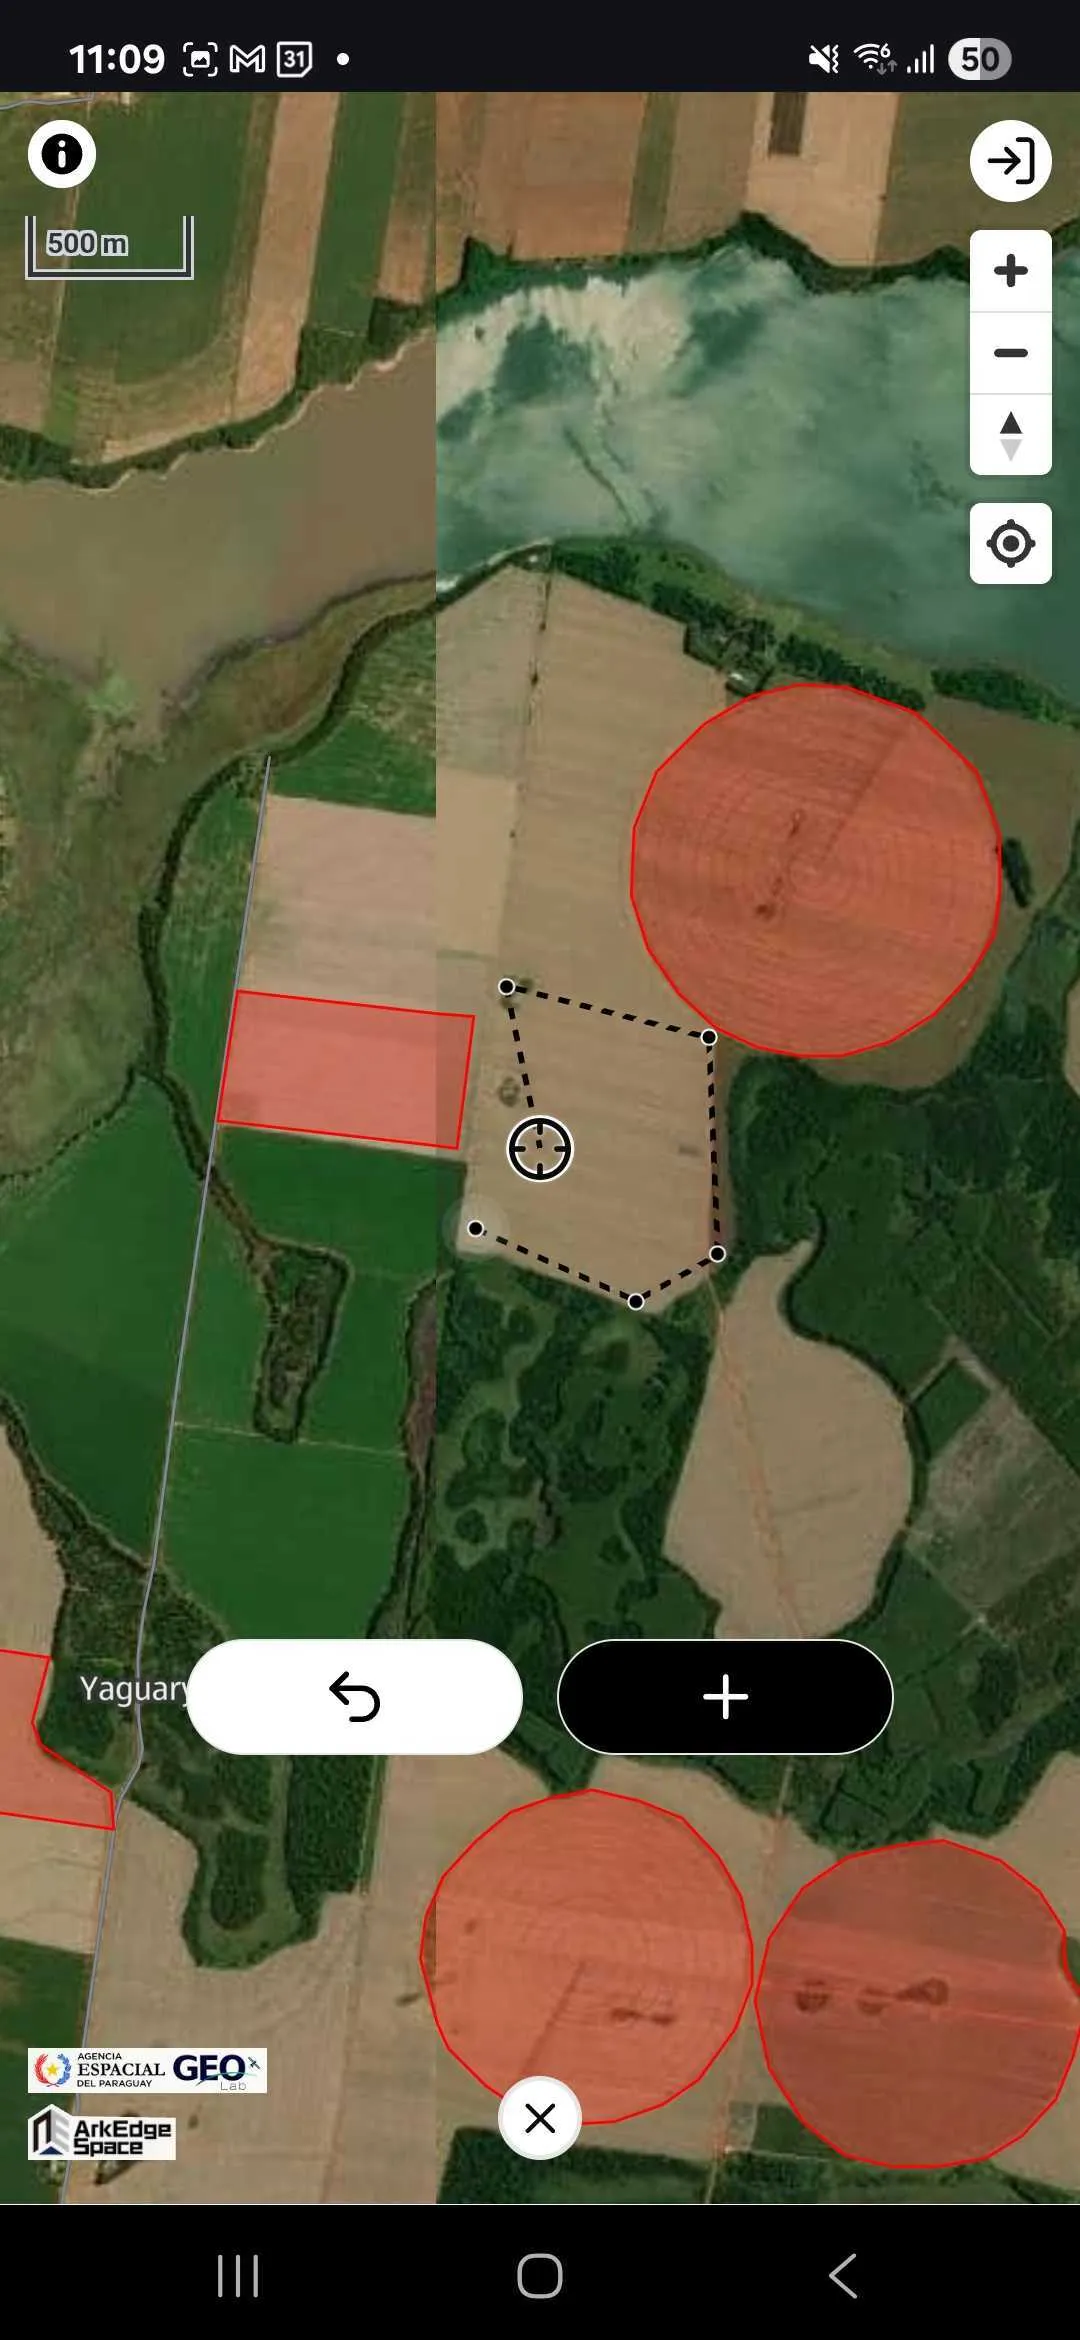
Section titled “Farmland Selection”When you select a farmland, the app starts time-series data analysis. A farmland polygon is automatically generated by a machine learning model based on the selected location. Existing polygon data is used when it is available for that farmland. If you are not satisfied with the shape of the automatically generated farmland polygon, you can manually draw the shape as well.
Switching Satellite Data
Section titled “Switching Satellite Data”Once farmland selection is complete, satellite data becomes available for viewing.
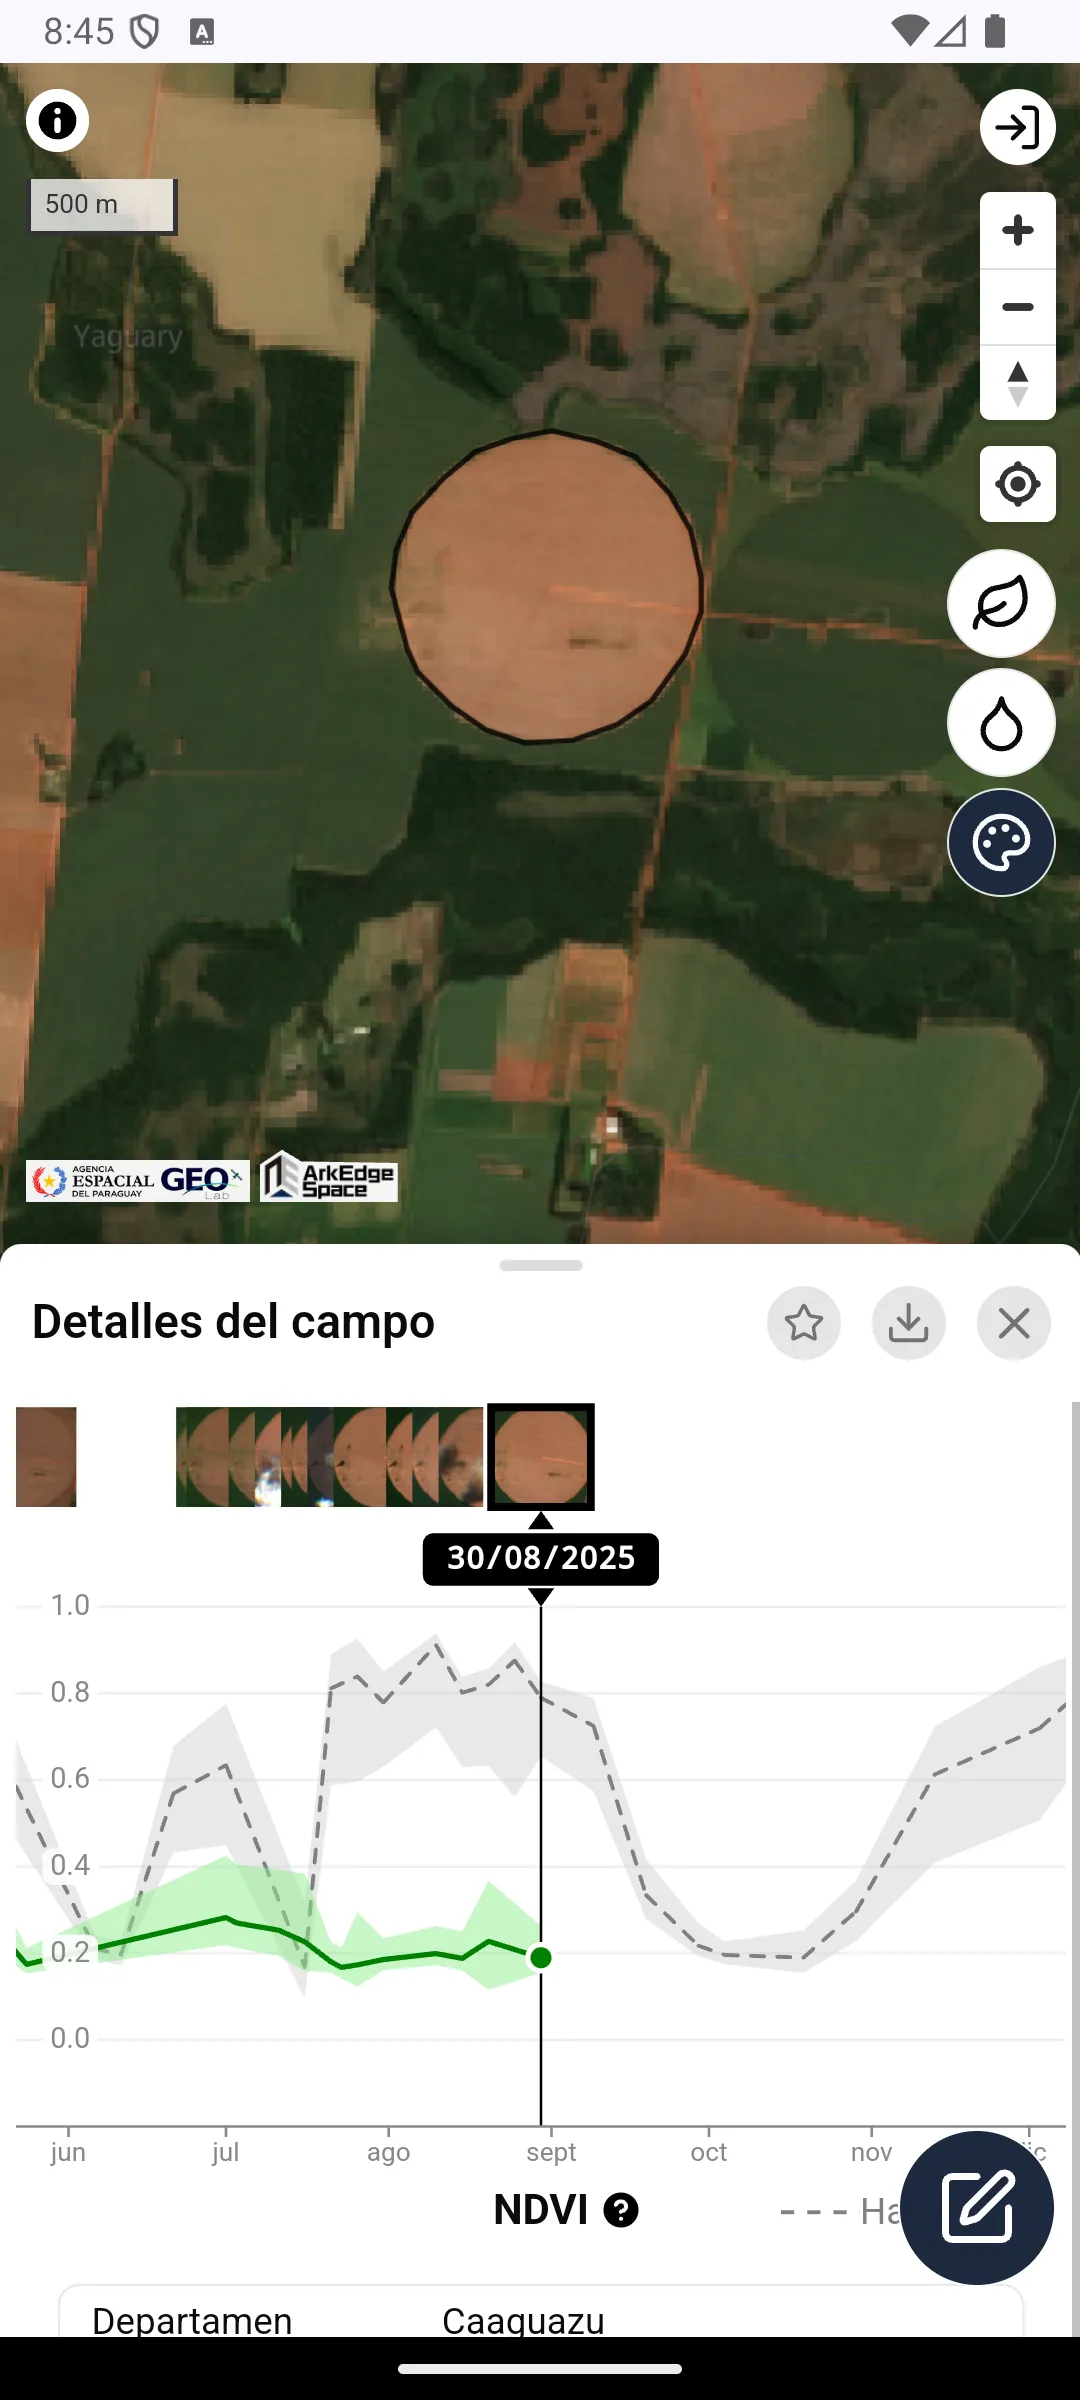
You can switch between the following satellite data by tapping the icons in the top right corner:
- True Color Image (TCI)
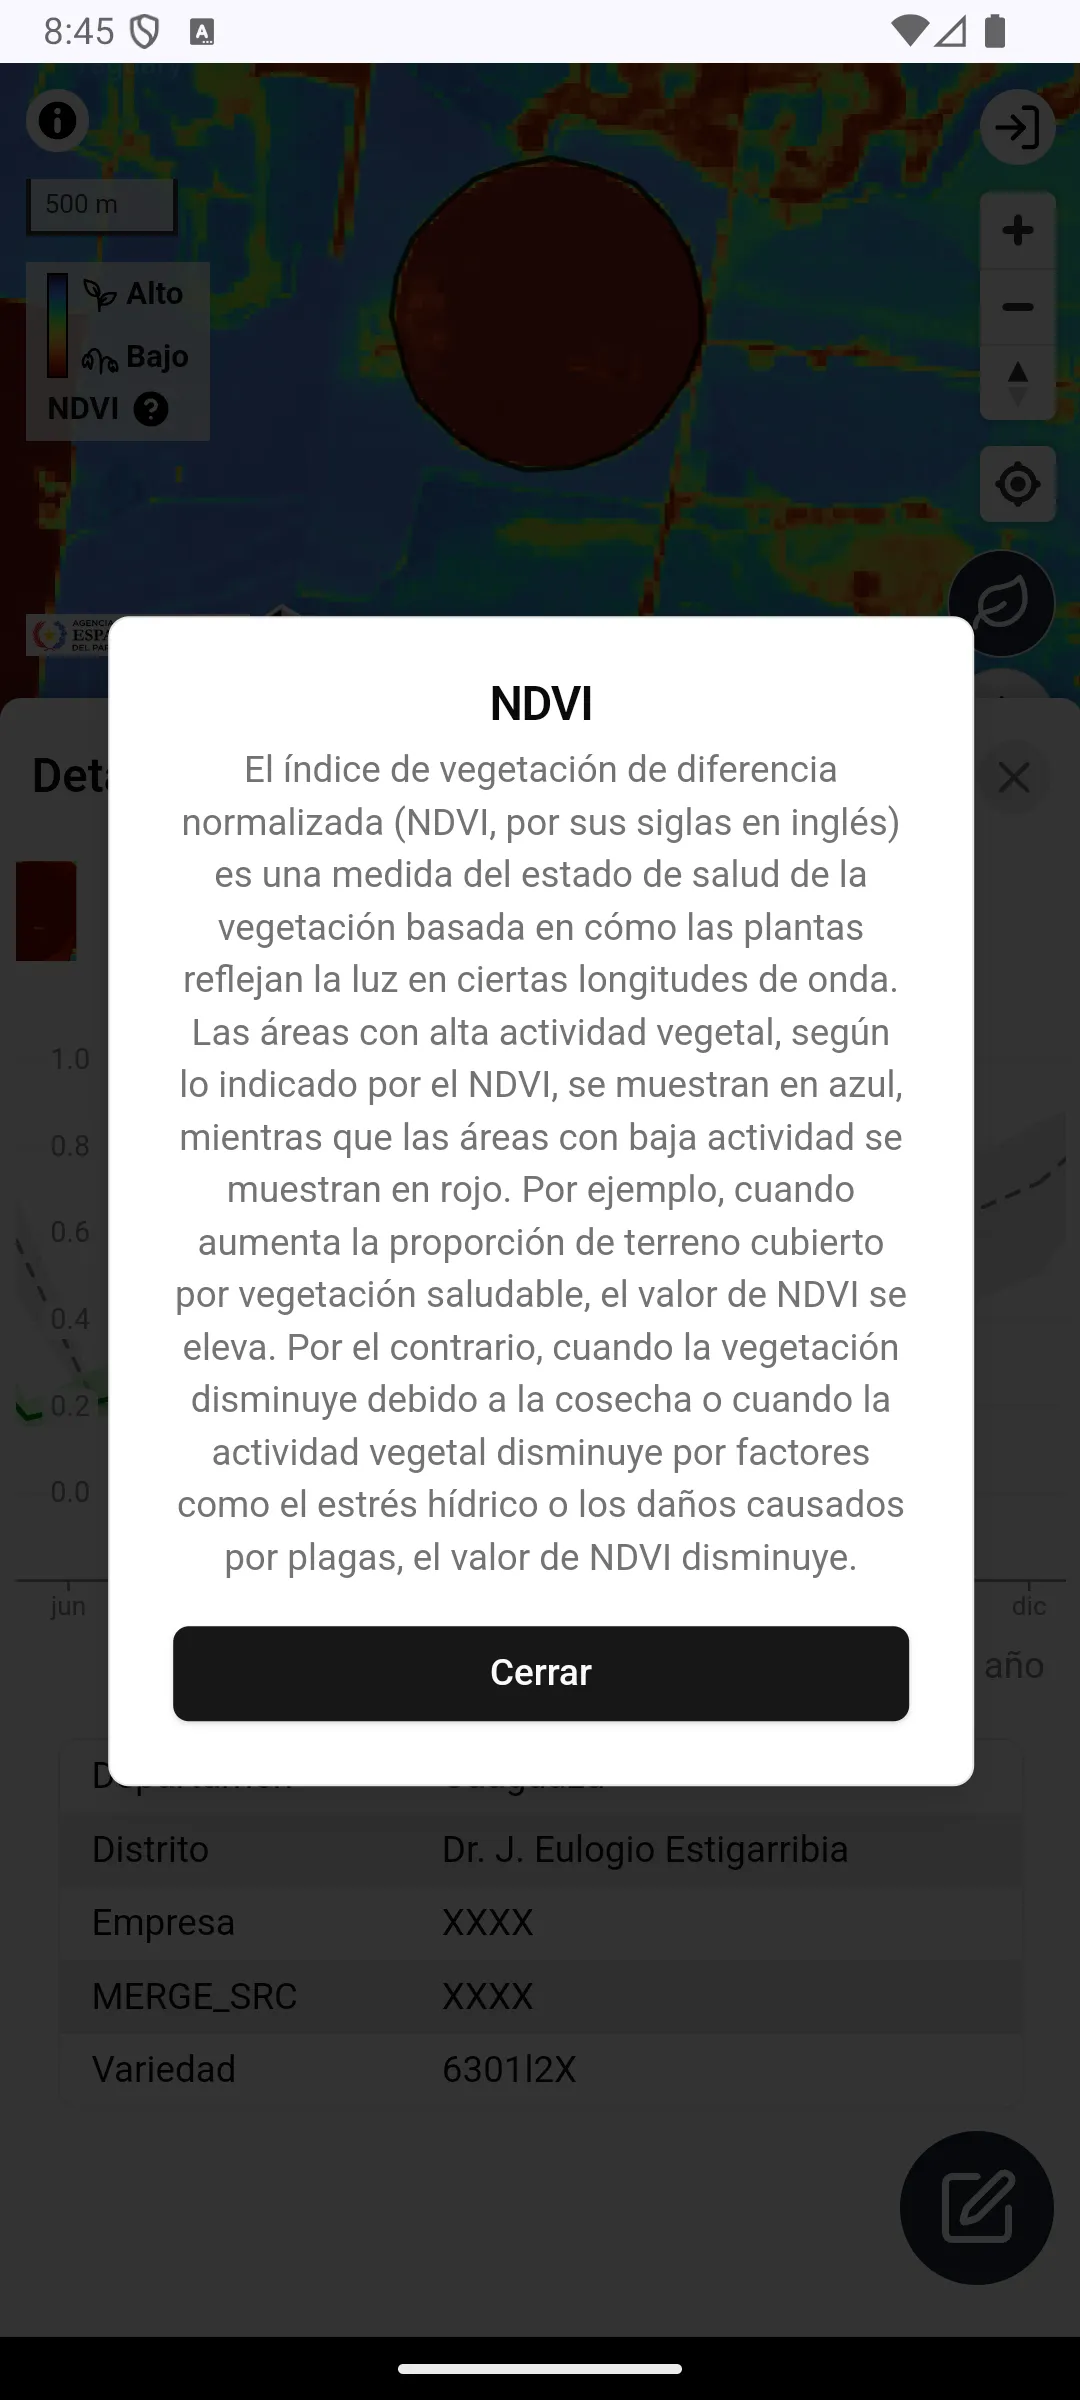
- Normalized Difference Vegetation Index (NDVI)
- Normalized Difference Moisture Index (NDMI)
When you deselect the icons, high-resolution satellite imagery and maps are displayed as the base map. Additionally, you can scroll the bottom graph horizontally to navigate through the data by date.
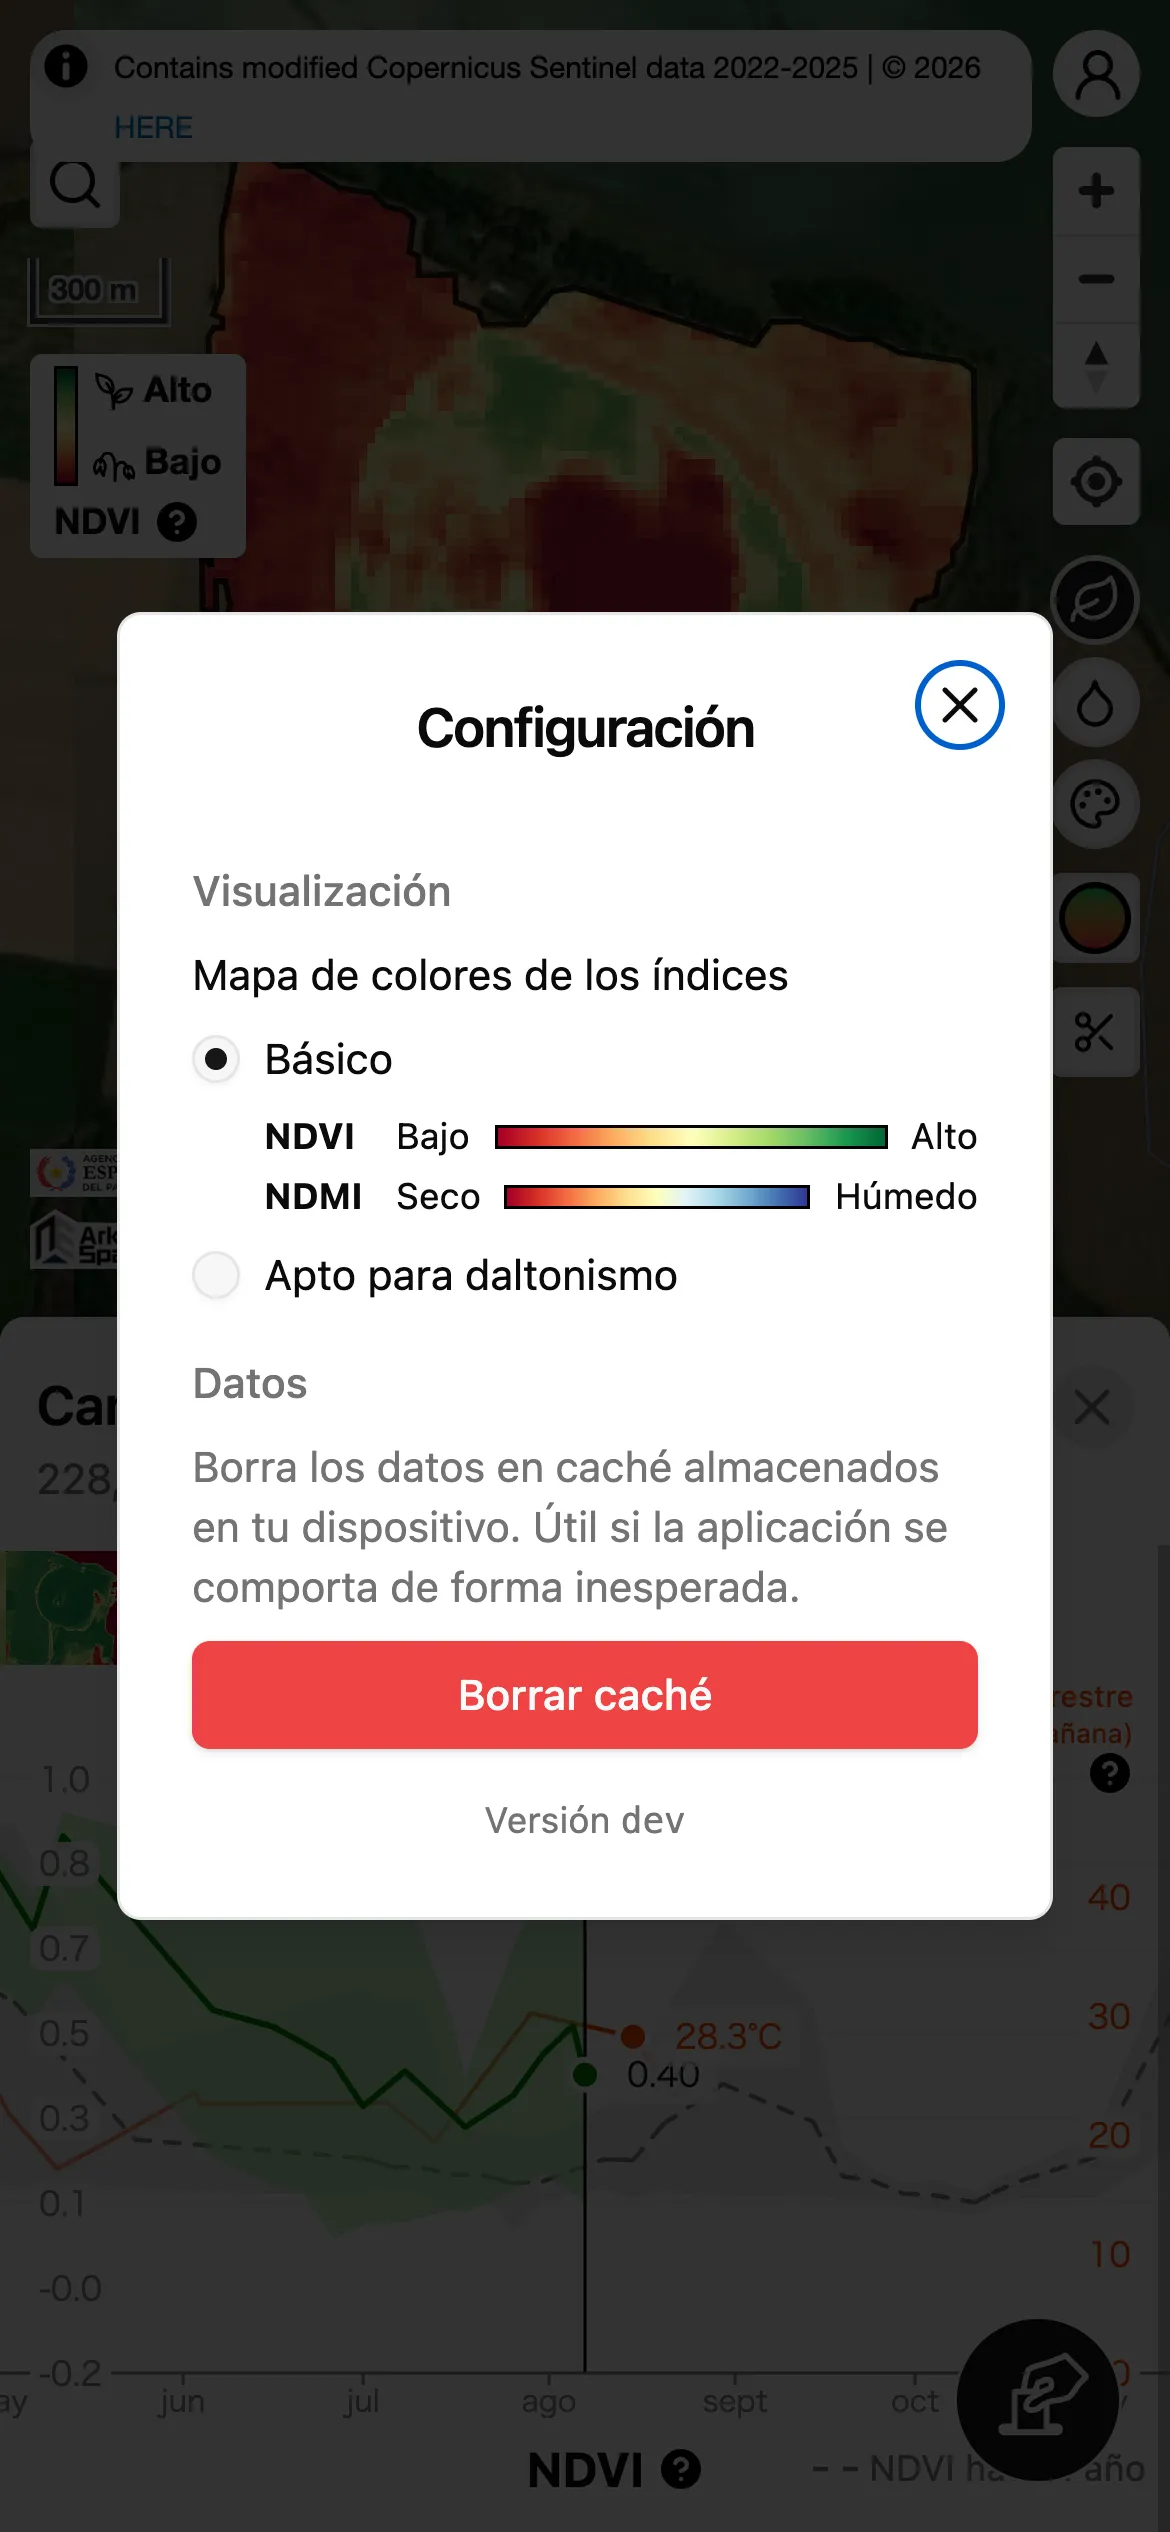
The color scheme (color map) used for NDVI / NDMI can be changed via Index color map in the settings screen, which is reachable from the account menu.
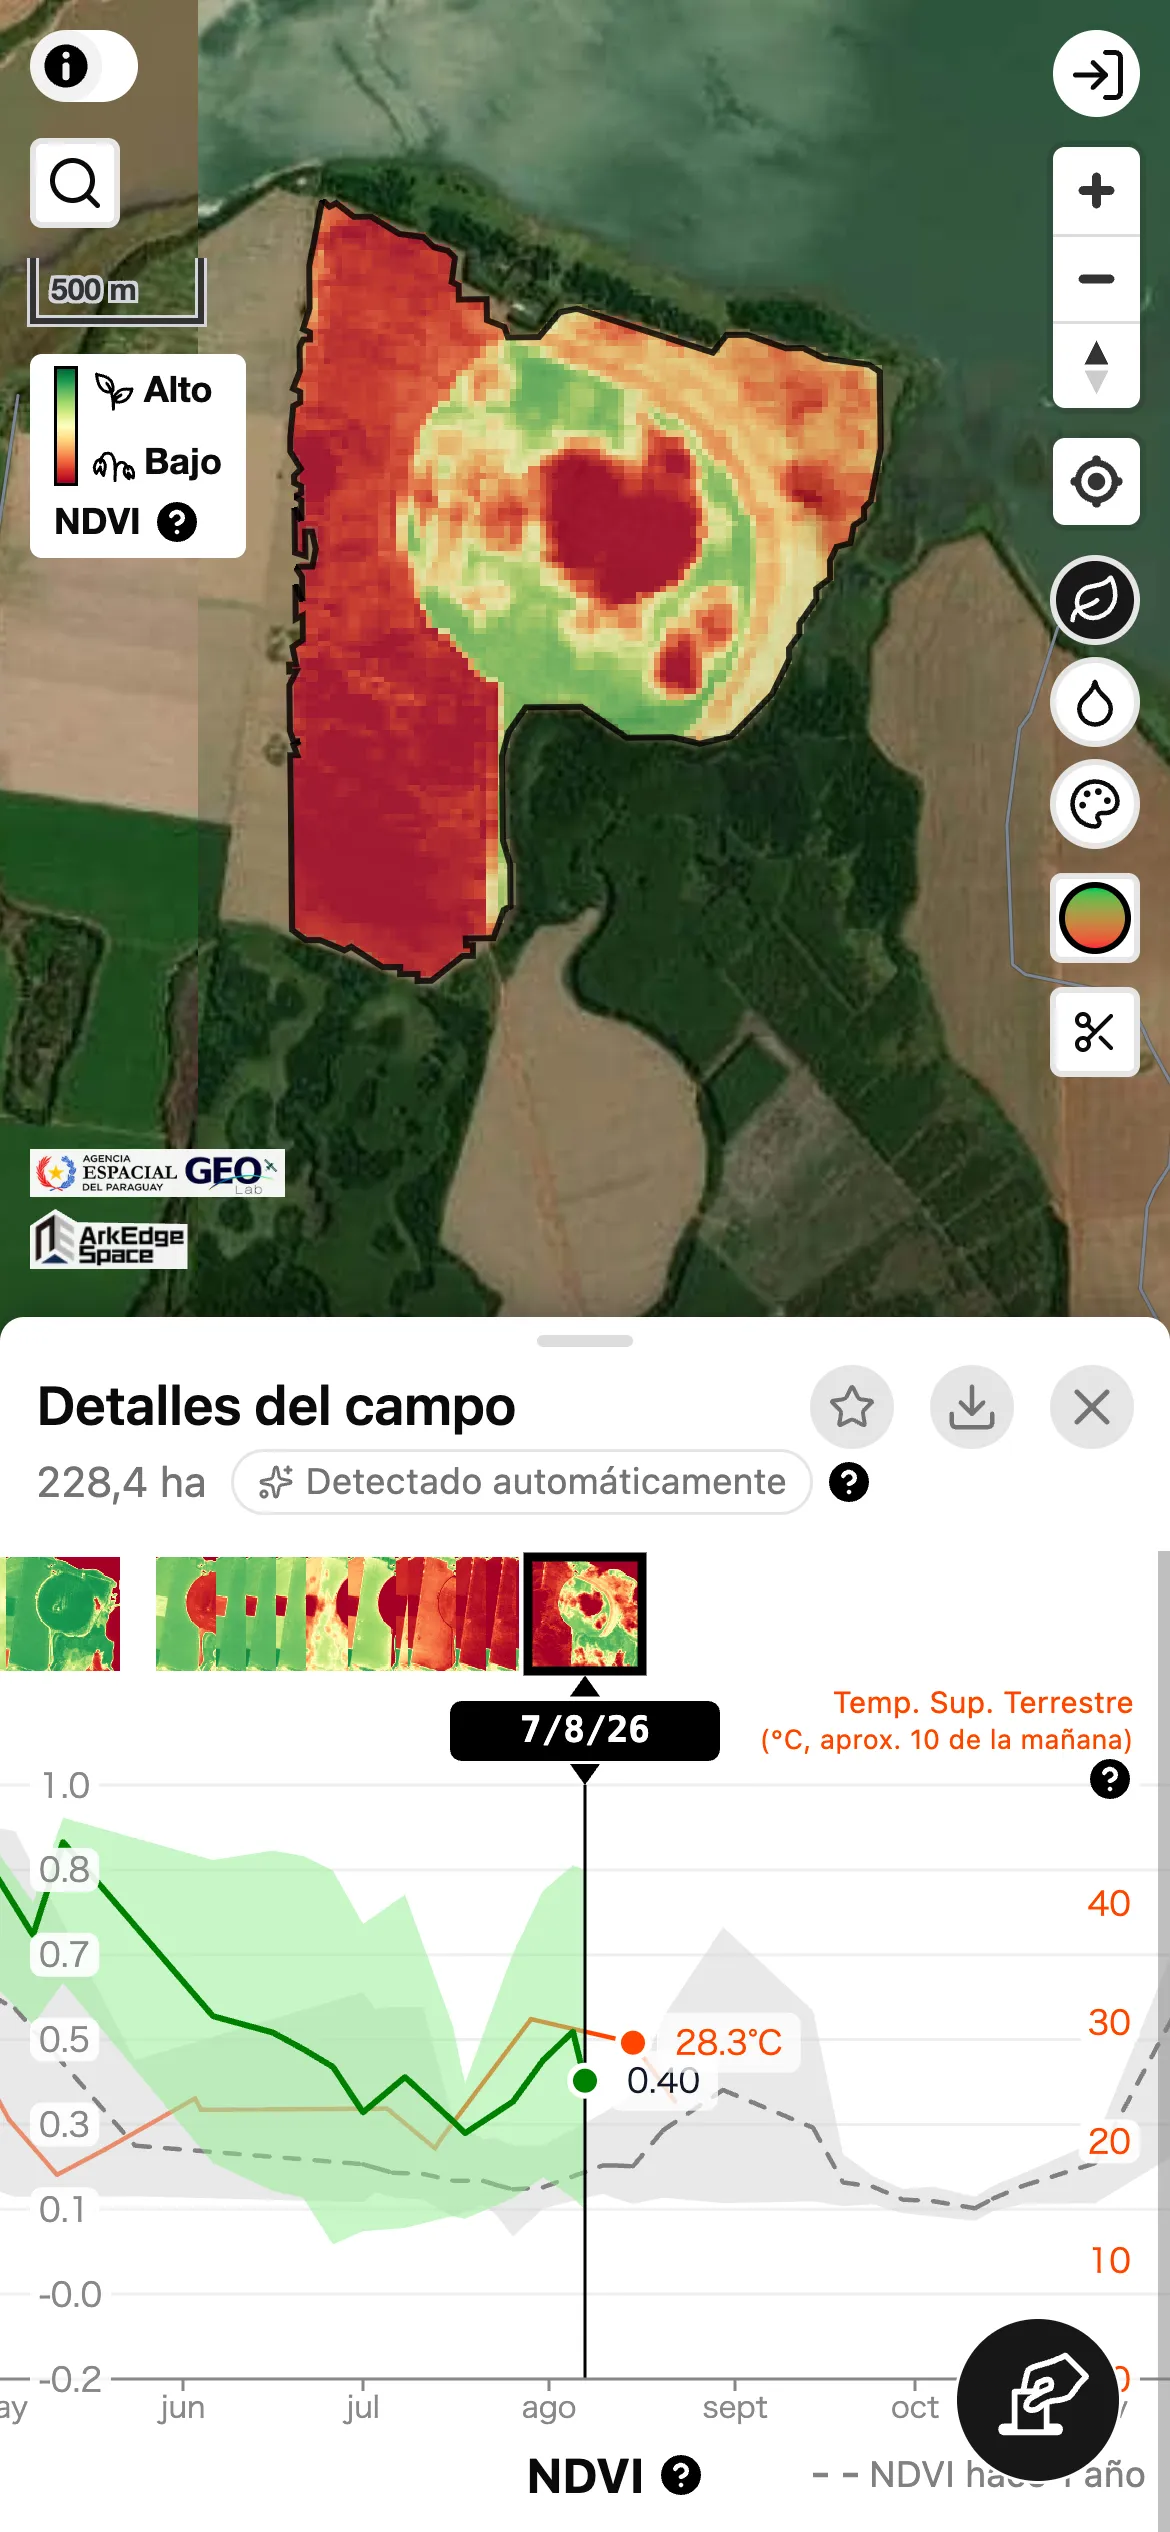
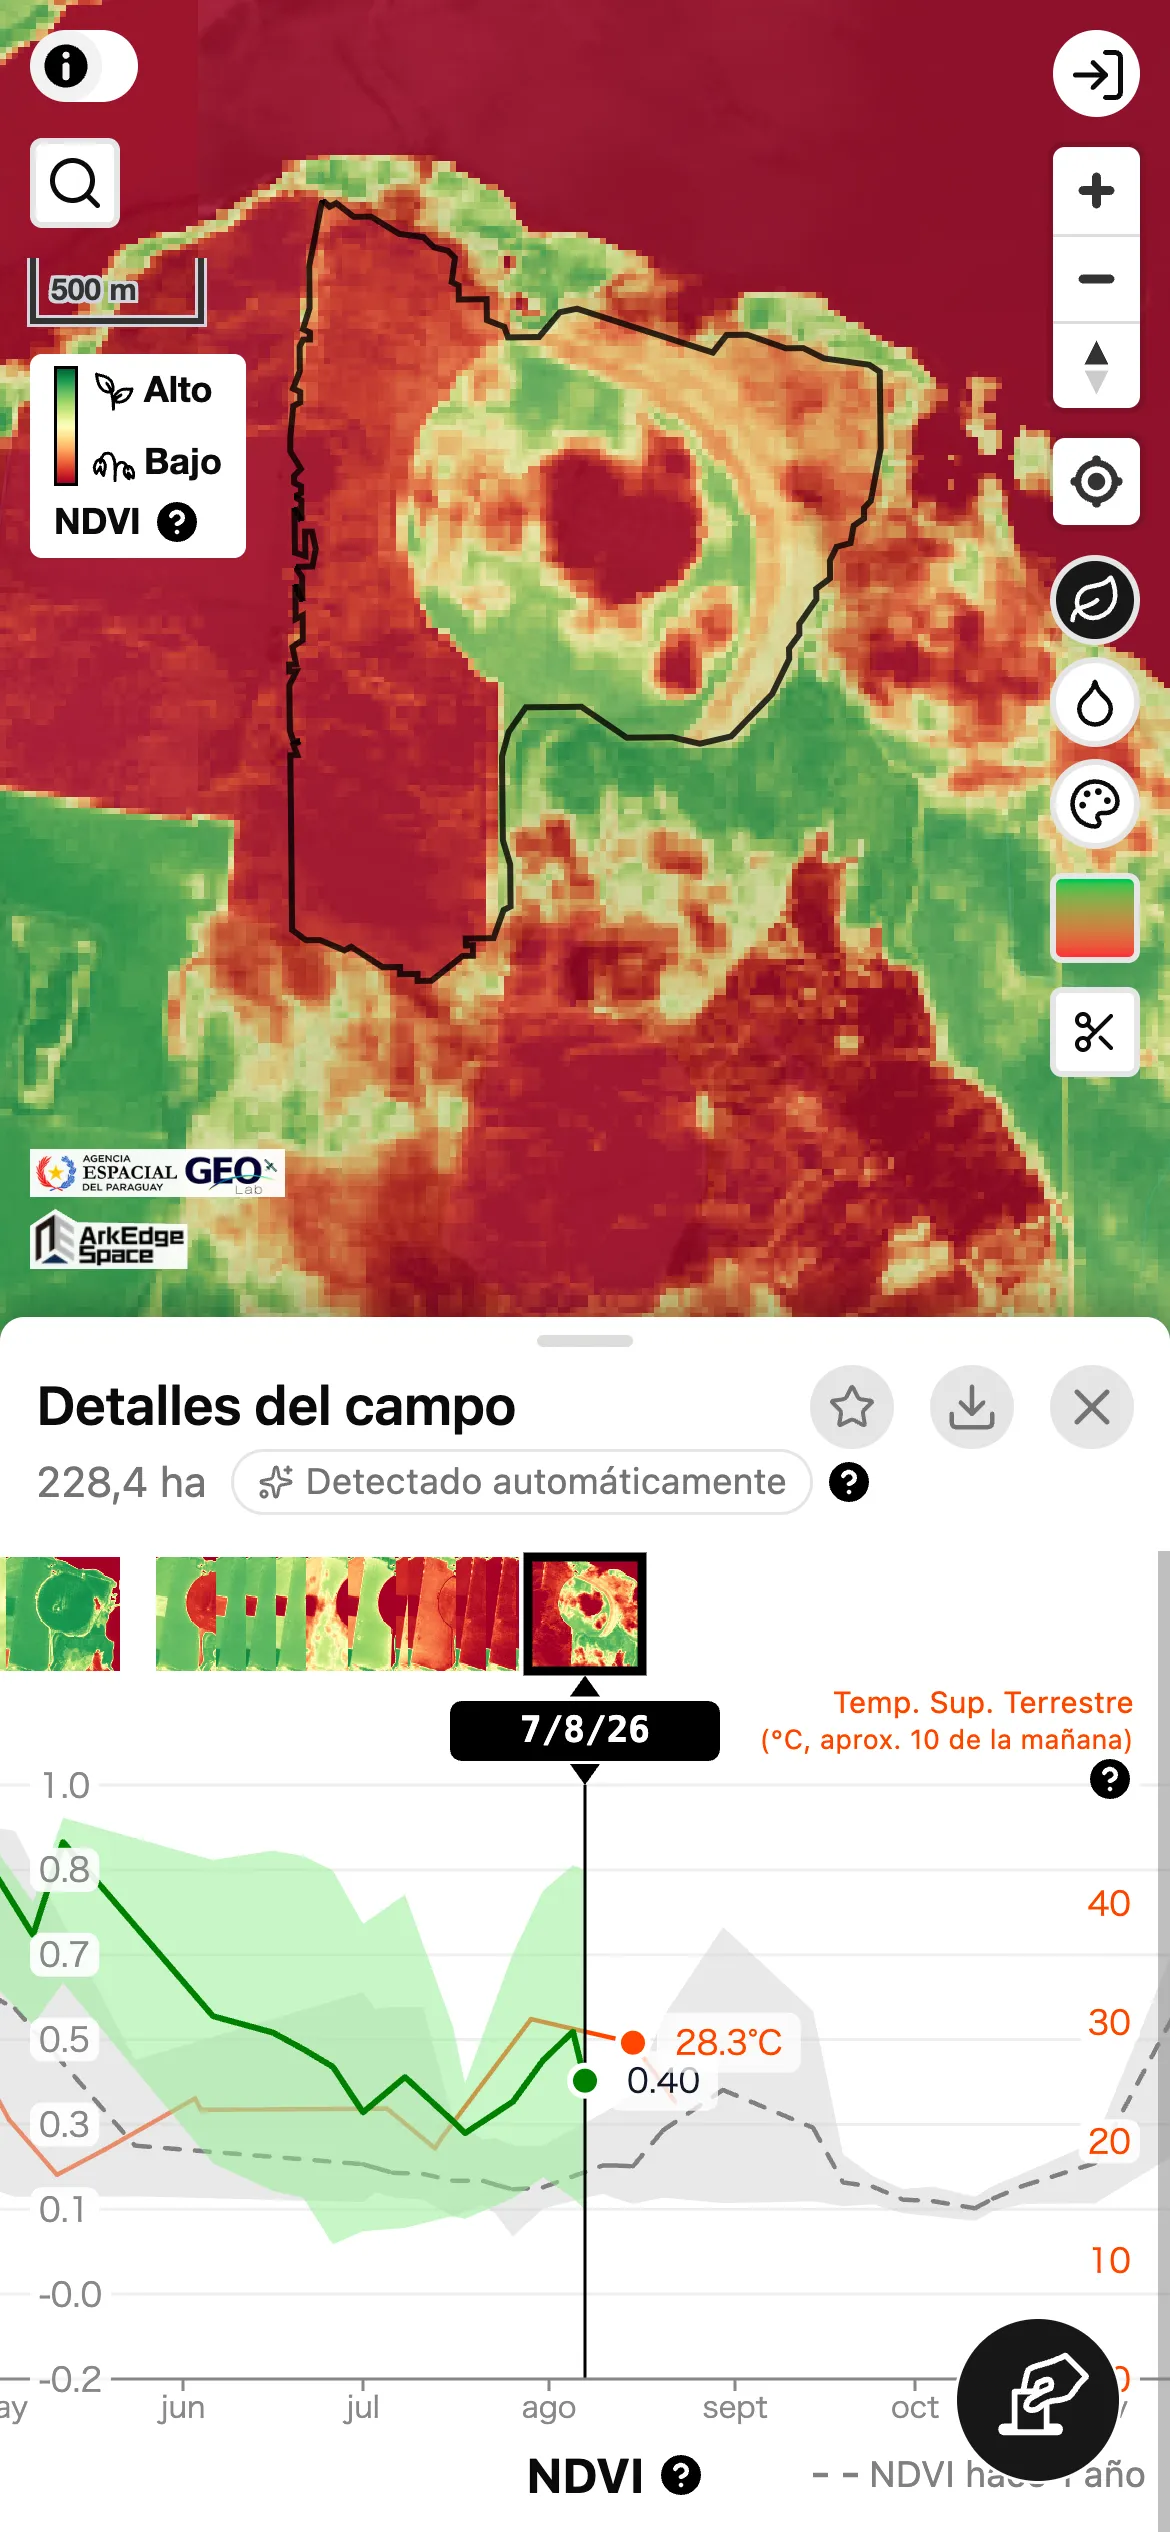
For readability, NDVI / NDMI are shown only inside the selected farmland polygon. If you also want to view the area outside the farmland, use the toggle button on the right side of the screen (circle icon with a green-to-red gradient). TCI is not affected by this cropping.
Offline Usage
Section titled “Offline Usage”If you want to use the low-resolution satellite background imagery while offline, switch to the Lo-Res view in advance while online, display the area you need, and then run Save Lo-Res offline.
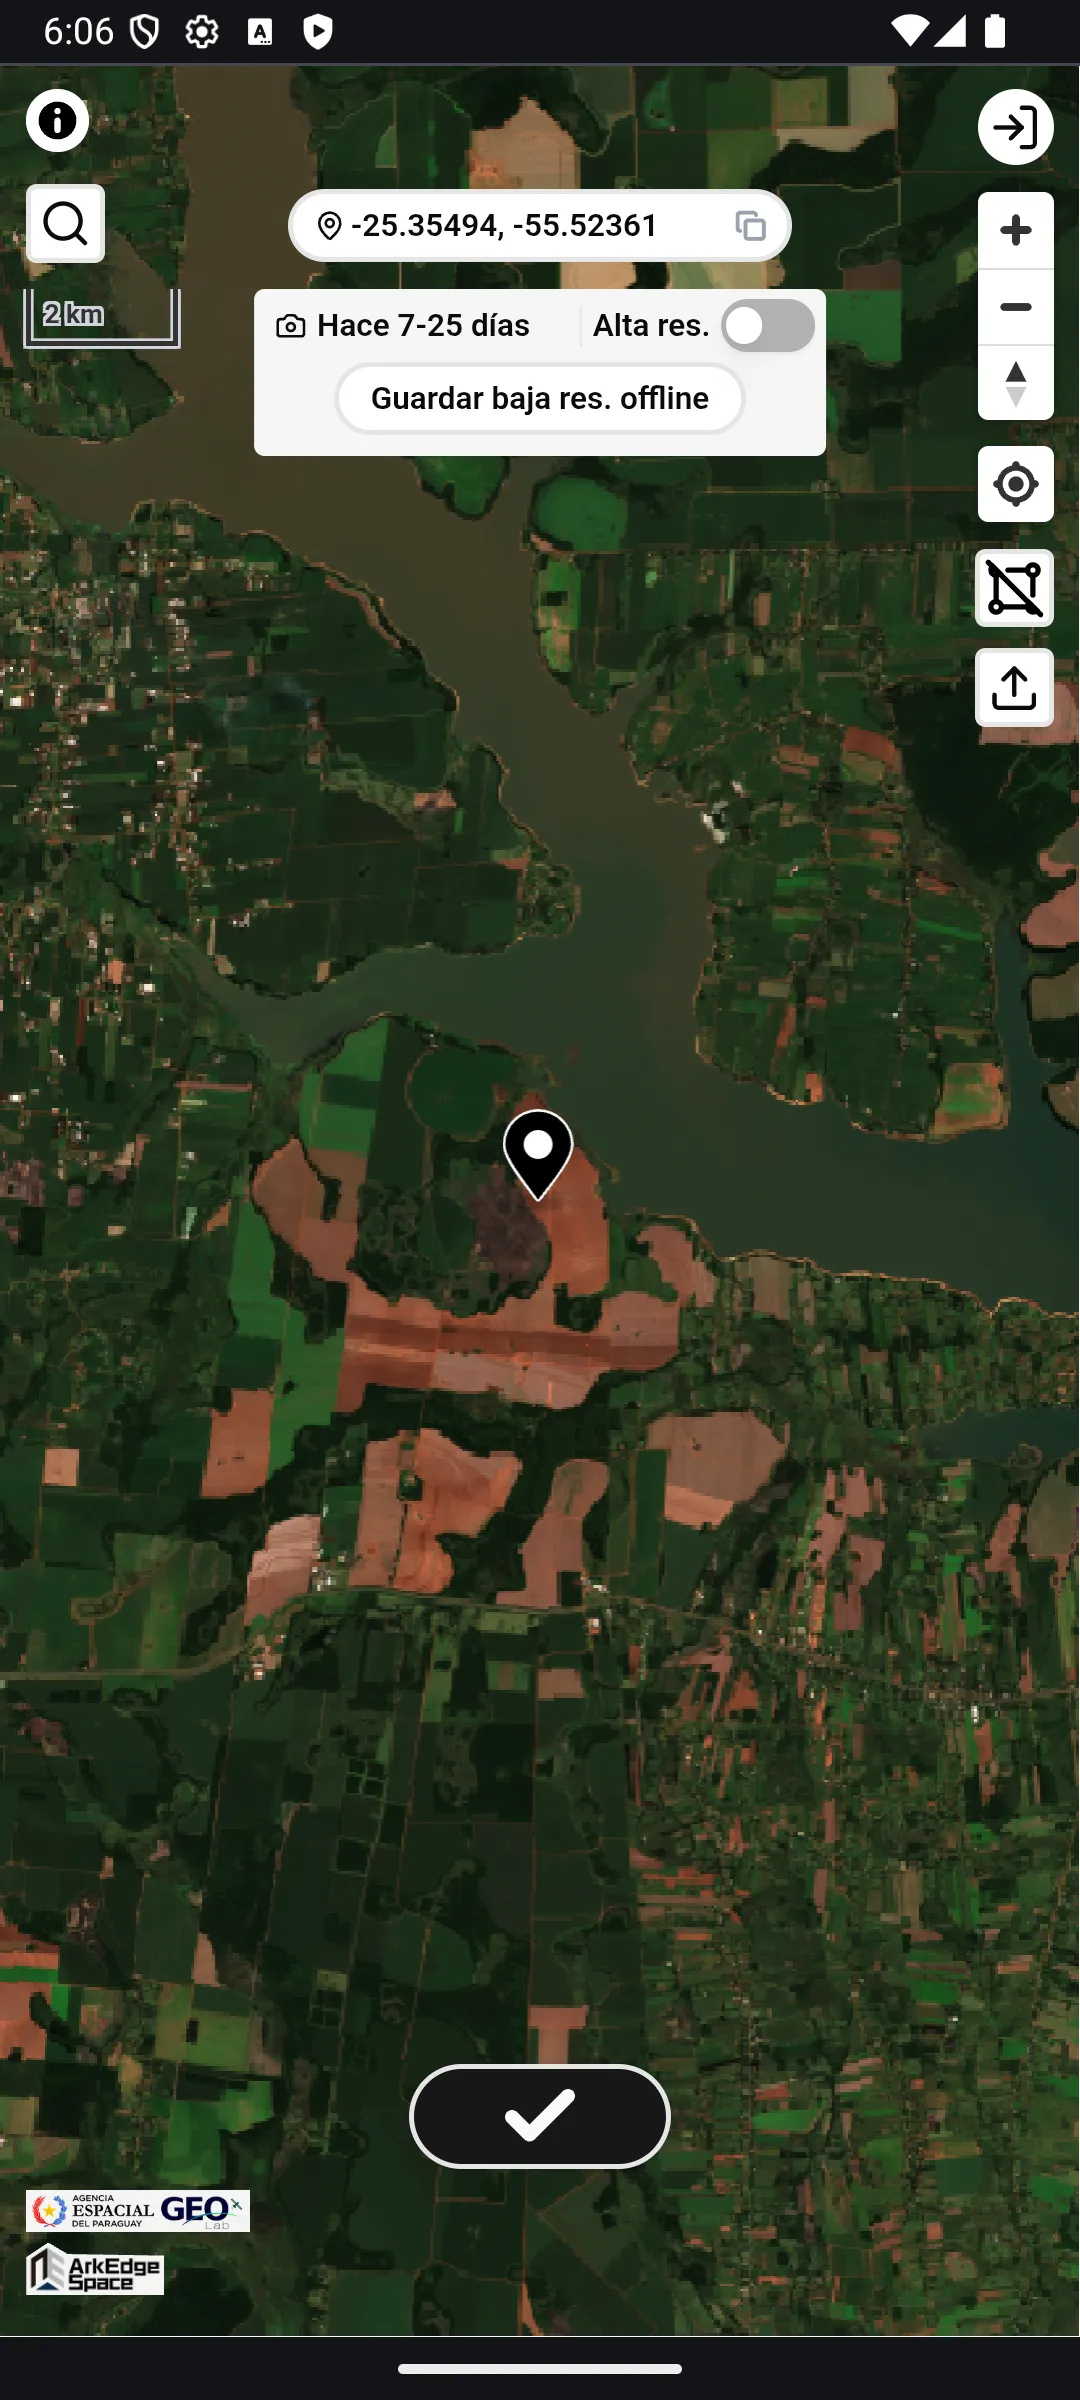
Save Lo-Res offline is only available while the Lo-Res background is displayed.
Tapping the button saves the low-resolution background imagery for the area currently displayed to your device.
Save Lo-Res offline only saves the Lo-Res background imagery for the area displayed at that moment.
If you want to use it for another location, navigate to that location and repeat the same operation.
The following features, which rely only on the device’s location capabilities or local operations, are also available offline:
- Moving the map to the current location using the location button
- Moving the map to a specific point by entering coordinates
- Displaying and copying the coordinates (latitude and longitude) of the map center
- Viewing the bookmark list, and searching or sorting it
The seasons of a bookmark (see Seasons) are not saved on your device. While offline, a bookmark is shown with its latest season only. Data for the evaluation trial (see Evaluation Trial Data) is not shown while offline either.
Time Series Data Graph
Section titled “Time Series Data Graph”Once farmland selection is complete, a time series graph for the selected farmland is displayed, showing NDVI values and land surface temperature (LST) derived from Landsat 8/9.
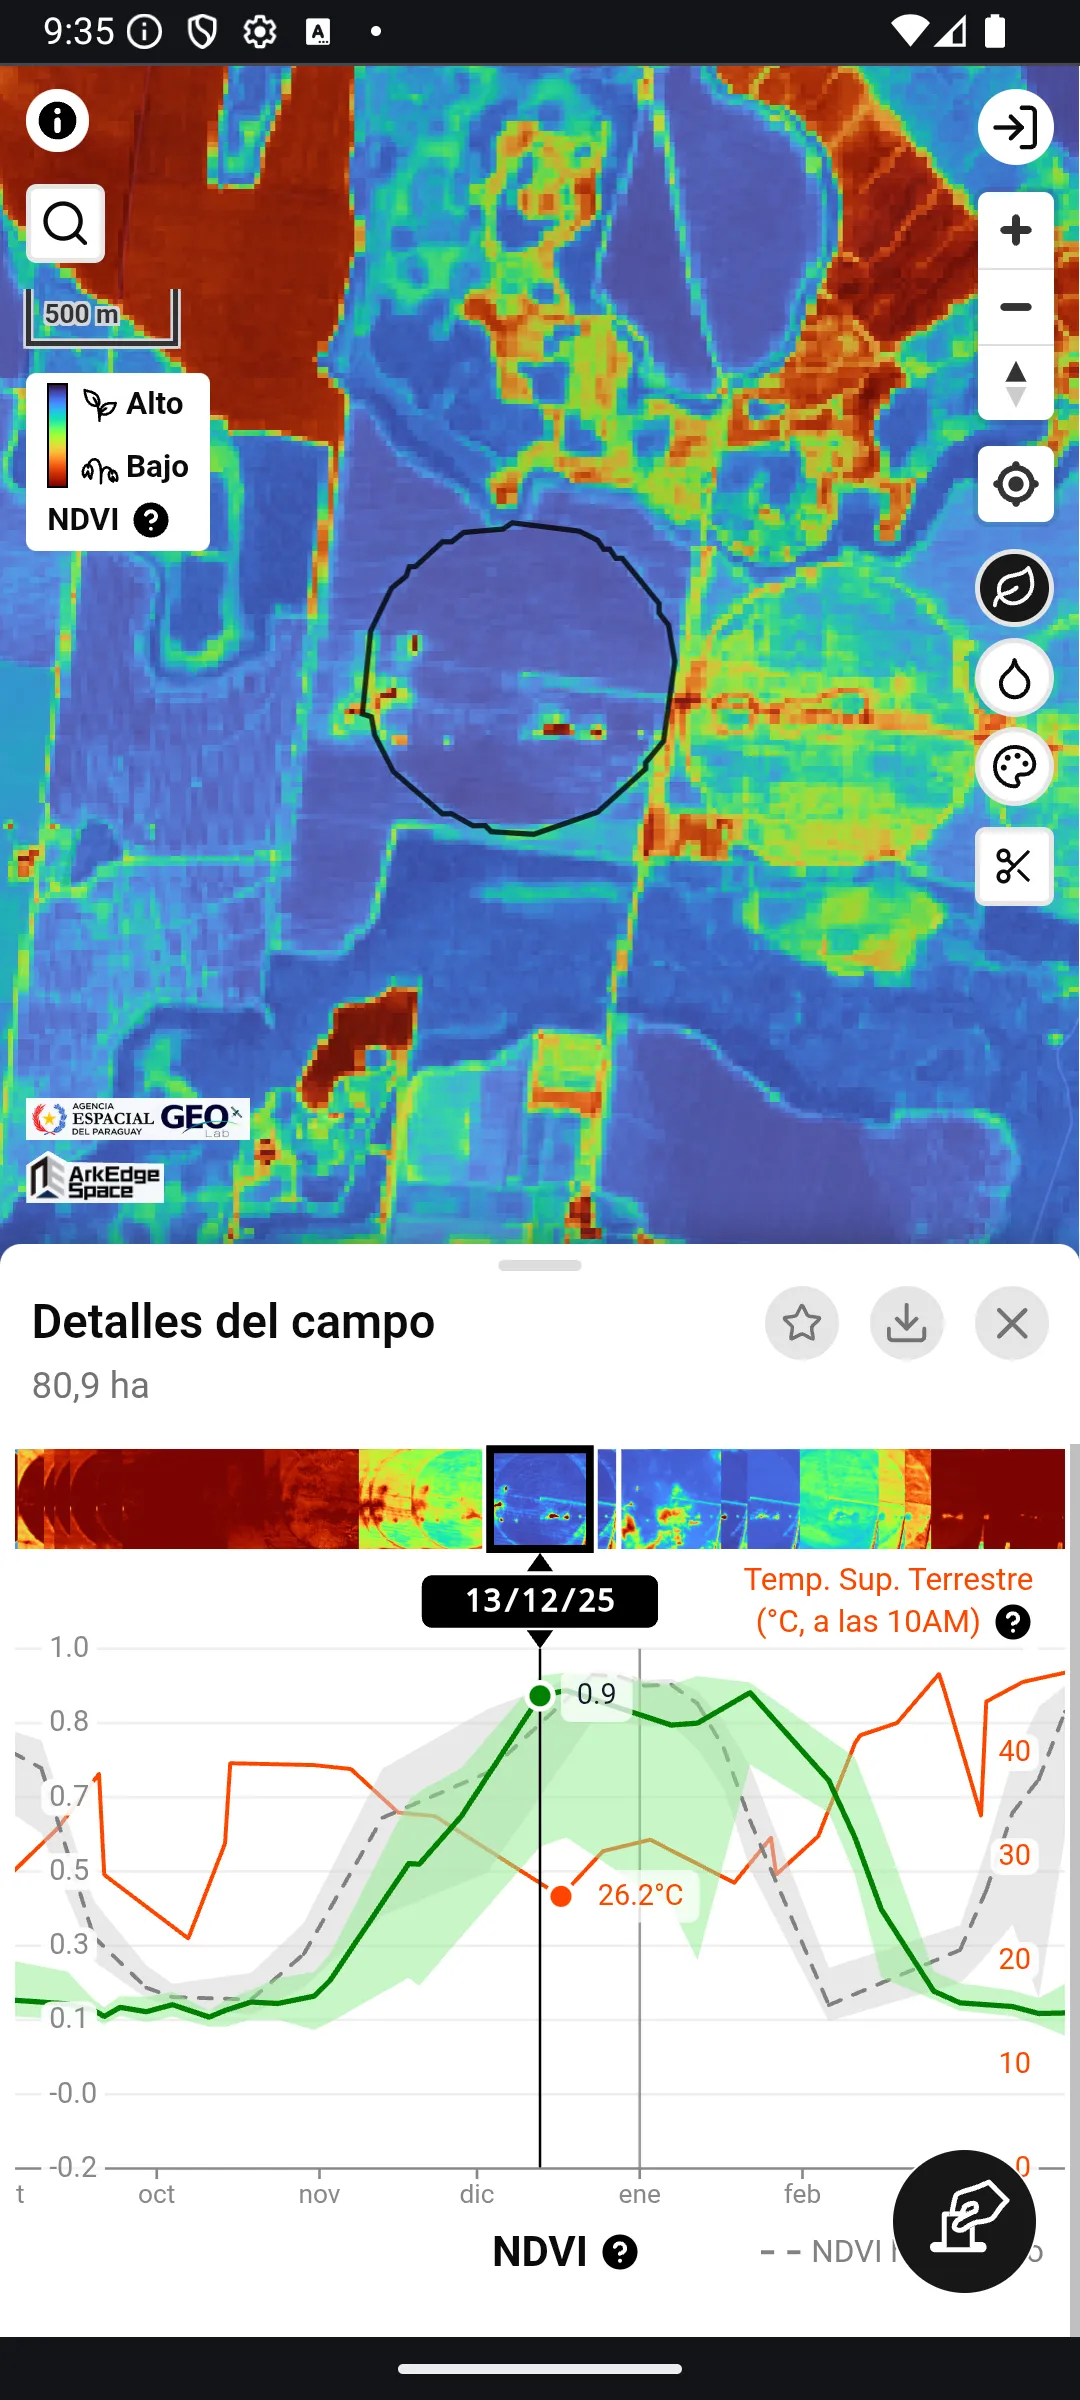
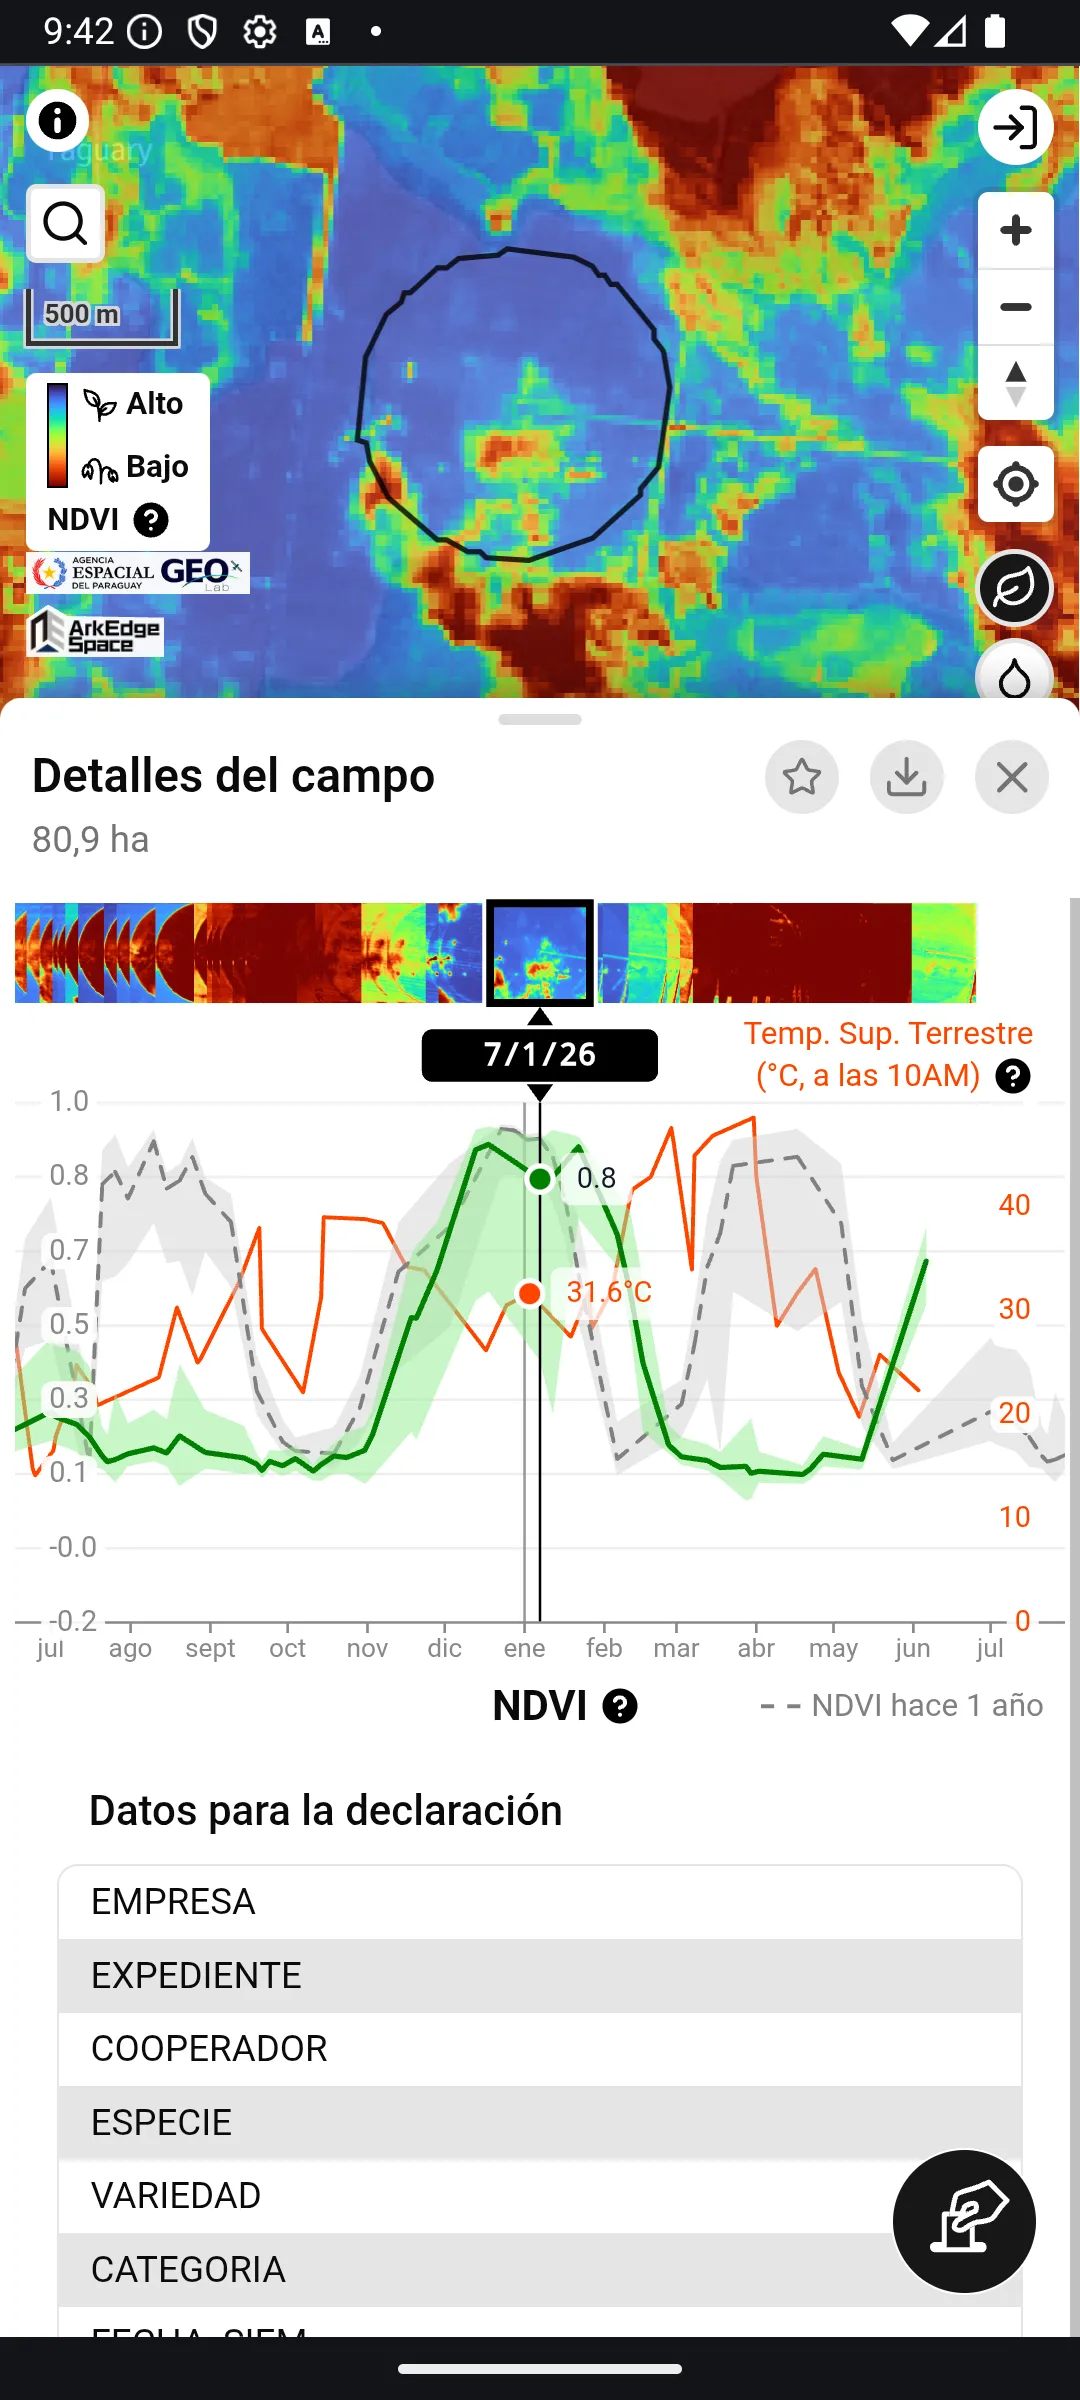
The green line shows NDVI values, while the gray line shows NDVI values from one year prior. The thick line represents the mean value for the entire farmland, while the upper and lower edges of the band represent the 98th and 2nd percentiles, respectively.
Land surface temperature values are derived from the thermal infrared band of Landsat 8/9 and displayed in degrees Celsius.
This graph can be scrolled horizontally and can also be zoomed in and out along the time axis.
Entering the Description and Declaration Data
Section titled “Entering the Description and Declaration Data”When a farmland is selected, the details view shows the Description and Data for the seed field (data used for declaring the seed field to SENAVE) sections. If the farmland has other attributes (for example, columns from an imported file), they are shown in a separate Other data section.
Tap the pencil button to edit their contents. Editing requires login; if you are not logged in, a dialog prompting you to log in is displayed. Save can be pressed once you have changed something.
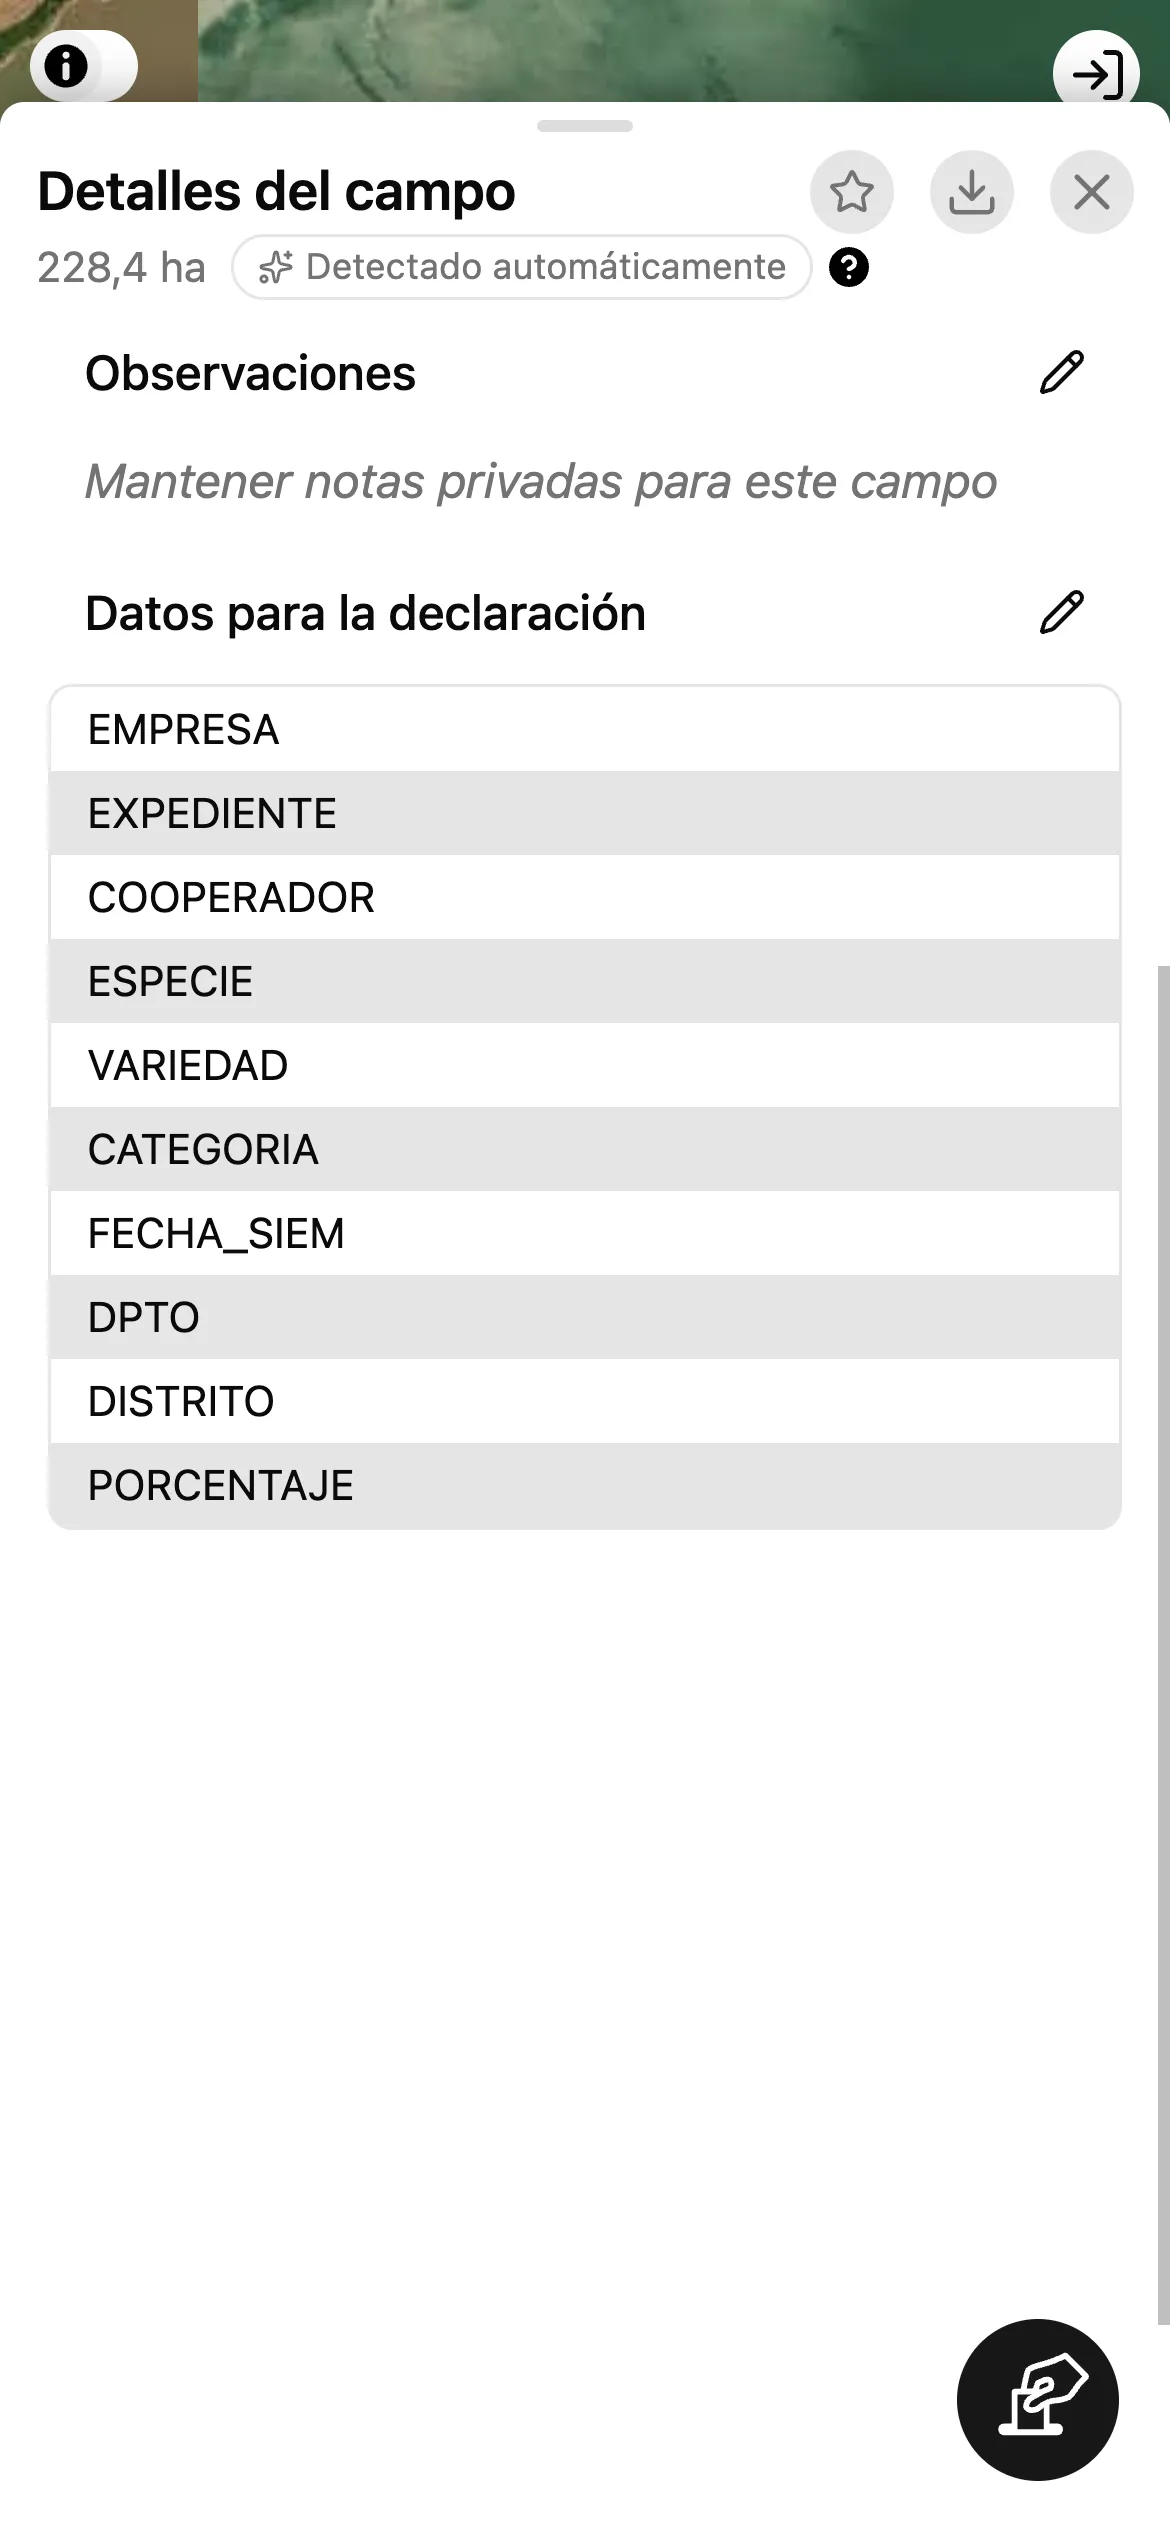
Some items help you enter a value in the expected form:
- ESPECIE suggests the standard values, and DPTO (department) and DISTRITO (district) suggest Paraguay’s departments and districts. As you type, only the values that start with what you typed are suggested, ignoring accents and capital letters (
itasuggestsItapúa). Tap an empty field to see every suggestion. - Once DPTO is a department of Paraguay, DISTRITO suggests only the districts of that department. A district already entered is kept when you change the department.
- EMPRESA, COOPERADOR, VARIEDAD, CATEGORIA SEMBRADA and CATEGORIA A PRODUCIR suggest the values already entered on your other farmlands.
- In all of these items you can also type a value that is not suggested, such as an address outside Paraguay.
- FECHA DE SIEMBRA (sowing date) is chosen with a date picker.
- SUPERFICIE DECLARADA is the declared area in hectares (
ha). It takes a number of 0 or more (for example,12or12,5); a value that is not such a number cannot be saved. If the farmland has no declared area yet, the field is filled in with the area shown in the details view, which is that of the selected season (rounded to two decimal places), and saving the edit screen saves it.
The values in Other data can be edited too. A value saved as a number stays a number: enter a number (for example, 12 or 12,5), or leave the field empty to clear it; a value that is not a number cannot be saved. For an attribute whose value is true or false, choose true, false or the empty option; the empty option clears the value.
A sowing date or a declared area saved earlier that cannot be read is shown as it is, with a note, and is kept unless you change it. To replace an unreadable sowing date, tap Choose a date.
The declaration data entered in Data for the seed field is added as attributes to the farmland polygon (GeoJSON) available from Data Download. When you choose Evaluation trial in the download screen, the evaluation trial data (see Evaluation Trial Data) is added instead.
Declaration data, including data from imported files, is saved and shown as entered. When you save the edit screen, a SUPERFICIE DECLARADA that can be read as a number is saved as a number. How the download writes the declaration items is described below.
To put the declaration data into a consistent form, press Correct next to Data for the seed field in the edit screen. Each item that changes shows before → after next to its name, and nothing is saved until you press Save:
- Spaces at the start and end are removed.
- A value that matches a standard choice is written in that choice’s form: in capital letters for ESPECIE (for example,
sojabecomesSOJA), and with the official spelling and accents for DPTO and DISTRITO (for example,itapuabecomesItapúa, andENCARNACIONbecomesEncarnación). - A sowing date (FECHA DE SIEMBRA) that can be read is treated as a date (day, month and year) rather than as free text. For now it is shown and downloaded in the form
2024-05-01(year-month-day). - A declared area (SUPERFICIE DECLARADA) of 0 or more is written as a number with a decimal point (
12,5and12,5 habecome12.5). - A value that cannot be read is left as it is.
All the items of Data for the seed field are included in the farmland polygon (GeoJSON) download when Seed field is chosen (it is chosen at first), before Other data when it is included (see Data Download); an item left blank is included with an empty value. They are written under short names of up to 10 characters, so that they can also be used as Shapefile column names: EMPRESA, EXPEDIENTE, COOPERADOR, ESPECIE, VARIEDAD, CAT_SEMB (CATEGORIA SEMBRADA), CAT_PROD (CATEGORIA A PRODUCIR), FECHA_SIEM (FECHA DE SIEMBRA), DPTO, DISTRITO and SUP_DECL (SUPERFICIE DECLARADA), in this order. A SUP_DECL that can be read as a number is downloaded as a number.
The attributes CATEGORIA and PORCENTAJE are not declaration items. Their values are shown in Other data.
If you edit and save on a farmland that is not bookmarked yet, the farmland is automatically saved as a bookmark.
On a bookmarked farmland, Data for the seed field belongs to the season selected in Seasons (see Seasons), and saving changes only that season. The name, the Description and Other data belong to the whole bookmark and are the same in every season.
Evaluation Trial Data
Section titled “Evaluation Trial Data”The data for declaring an evaluation trial to SENAVE (Ensayos de Evaluación Agronómica y de Calidad) is entered in Data for the evaluation trial, right below Data for the seed field. This section is shown only on bookmarked farmlands, while you are logged in and online. Tap the table or the pencil button (Edit data for the evaluation trial) to open the Edit data for the evaluation trial edit screen.
- NOMBRE DEL EVALUADOR (the evaluator’s name) is free text. It suggests the names you entered in your other evaluation trials.
- ESPECIE DEL ENSAYO (the crop of the trial) suggests the standard values, as in
Data for the seed field. - NÚMERO DE VARIEDADES DEL ENSAYO (number of varieties) and NÚMERO DE REPETICIONES (number of replications) take a whole number of 1 or more.
- SUPERFICIE DE LA PARCELA is the area of the trial plot in hectares (
ha). It takes a number of 0 or more (for example,12or12,5). The trial plot is part of the farmland, so the field is not filled in with the farmland’s area. - FECHA DE SIEMBRA (sowing date) and FECHA DE APROBACIÓN DEL ENSAYO (the date the trial was approved) are chosen with a date picker.
- In DEPARTAMENTO (department) / DISTRITO, as in
Data for the seed field, DISTRITO suggests only the districts of the selected department.
For a season that has no evaluation trial data yet, ESPECIE DEL ENSAYO, FECHA DE SIEMBRA, DEPARTAMENTO and DISTRITO are filled in beforehand with the values of the same season’s Data for the seed field (when you enter other items and save, these values are saved too).
A value that is not valid cannot be saved, and a message such as Enter a whole number of 1 or more. is shown. Clearing every field and saving removes the evaluation trial data.
The evaluation trial data also belongs to the season selected in Seasons (see Seasons). In Data Download, it is downloaded when you choose Evaluation trial as the declaration data that goes into the attributes of the farmland polygon (GeoJSON).
Seasons
Section titled “Seasons”A bookmarked farmland can keep a polygon, Data for the seed field and Data for the evaluation trial for each season, so that you can declare the same field again in a new season, even when its boundary has changed, without losing the previous one. The seasons are listed under Seasons in the details view, newest first. Each row shows the sowing date (FECHA DE SIEMBRA; the date the season was created when it is empty), the crop (ESPECIE) and the area.
- Tap a row to select that season. The polygon on the map, the area, the time series graph,
Data for the seed fieldandData for the evaluation trialswitch to that season. The selected season is kept when you reload the app. Duplicatecopies the selected season’s polygon and declaration data, including the evaluation trial data, into a new season, and selects it. Edit the new season for the new declaration. A farmland can have up to 20 seasons.- The button deletes the selected season, together with its evaluation trial data, after a confirmation. The last remaining season cannot be deleted; to delete the whole farmland, use the star button (see Bookmarks).
The bookmark list, the map and the thumbnail always show the newest season. Duplicating a season makes the copy the newest one, and deleting the newest season makes the next one the newest. Selecting a farmland from the list or from the map selects its newest season.
Notes and photos belong to the whole farmland, not to a season.
Bookmarks
Section titled “Bookmarks”In order to save frequently accessed farmlands, you can use the bookmark feature. To add a farmland to bookmarks, tap the star button after selecting the farmland. To name the bookmark, tap the edit button to the left of the star button, enter a name, and then tap the save button.
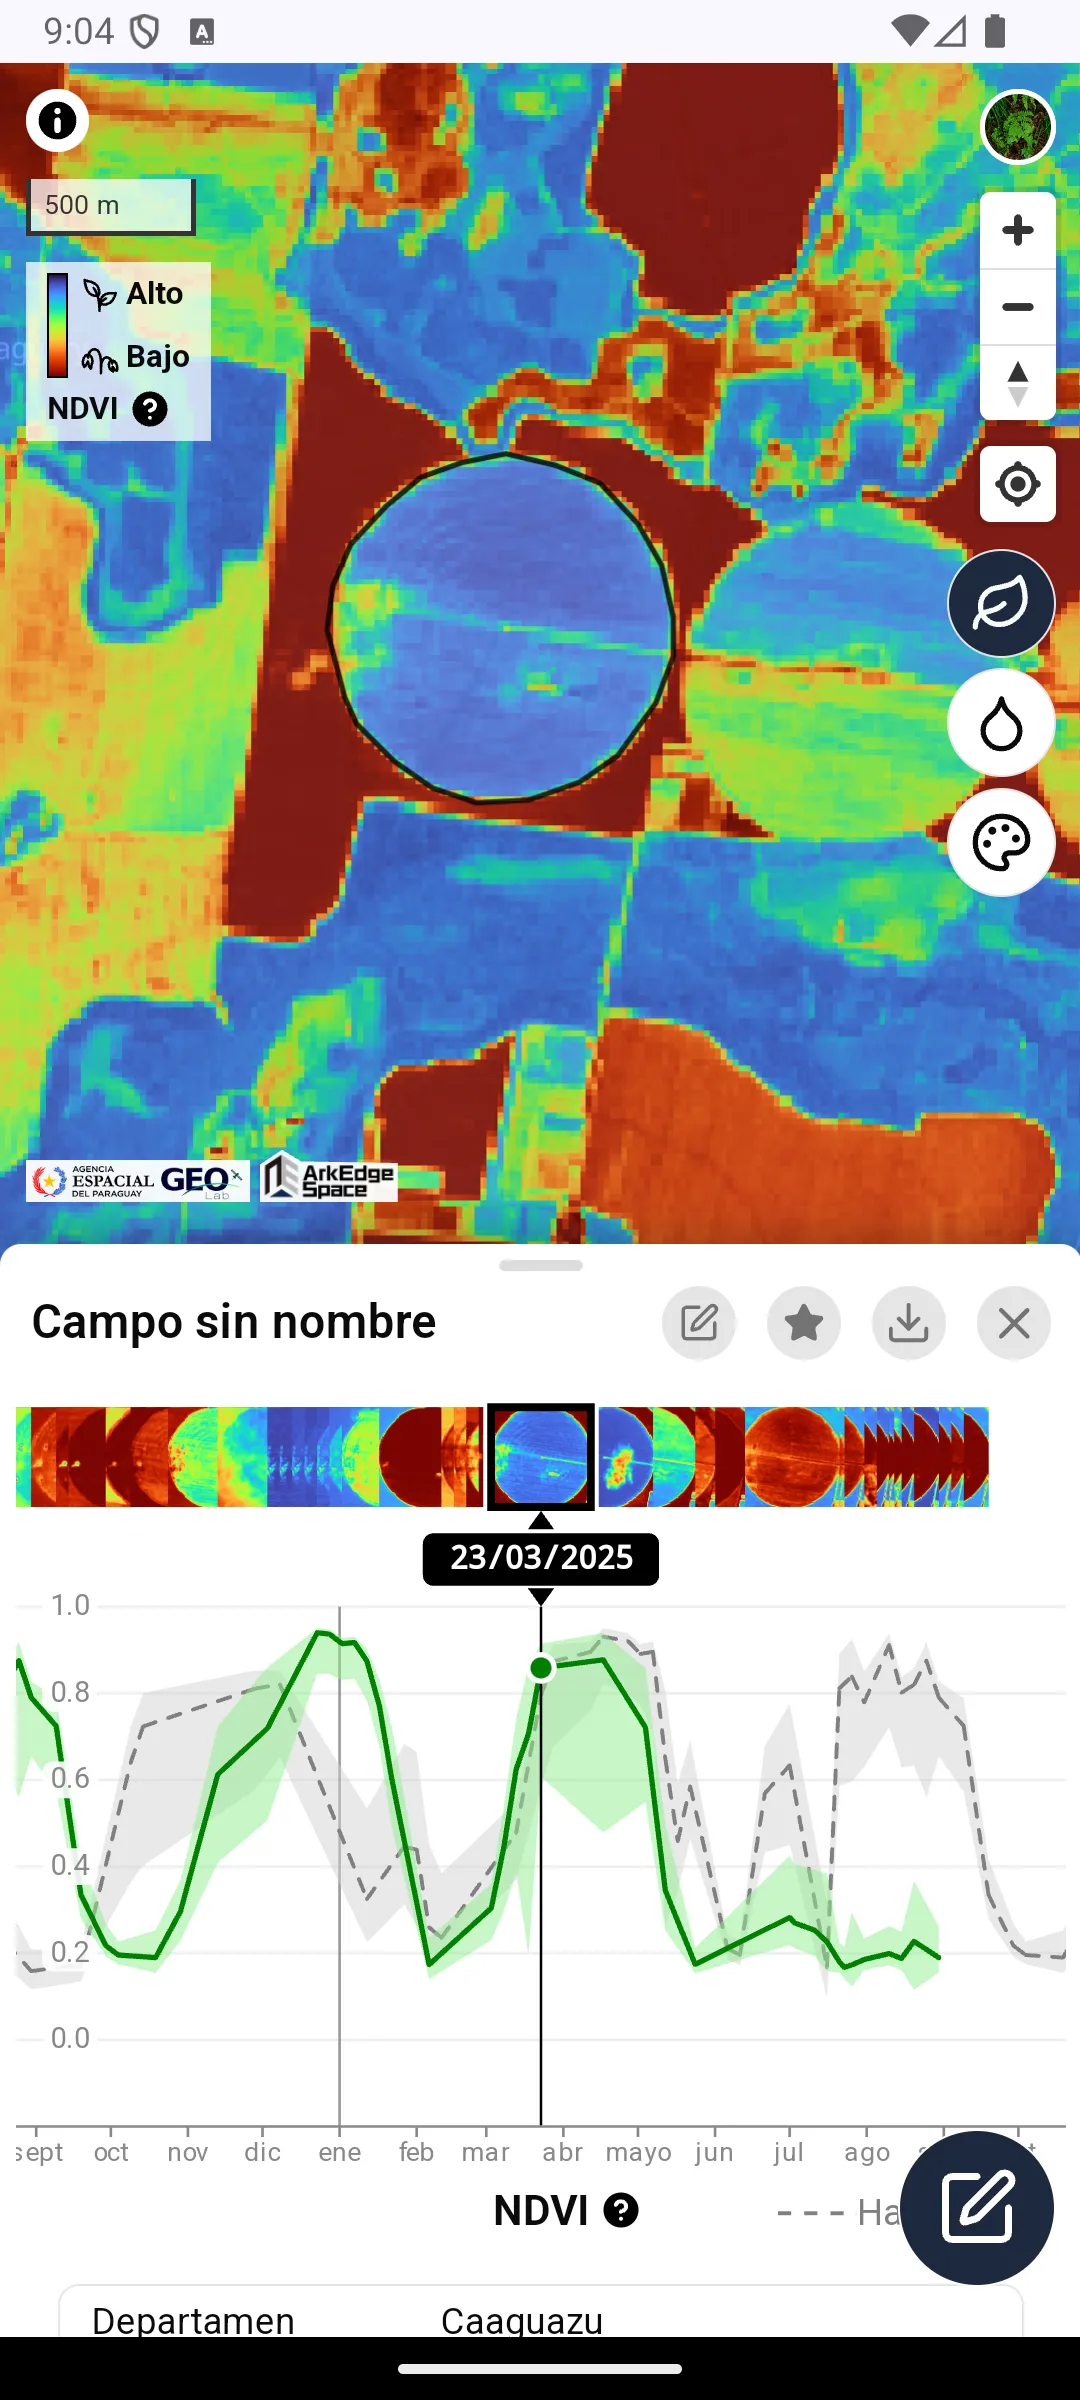
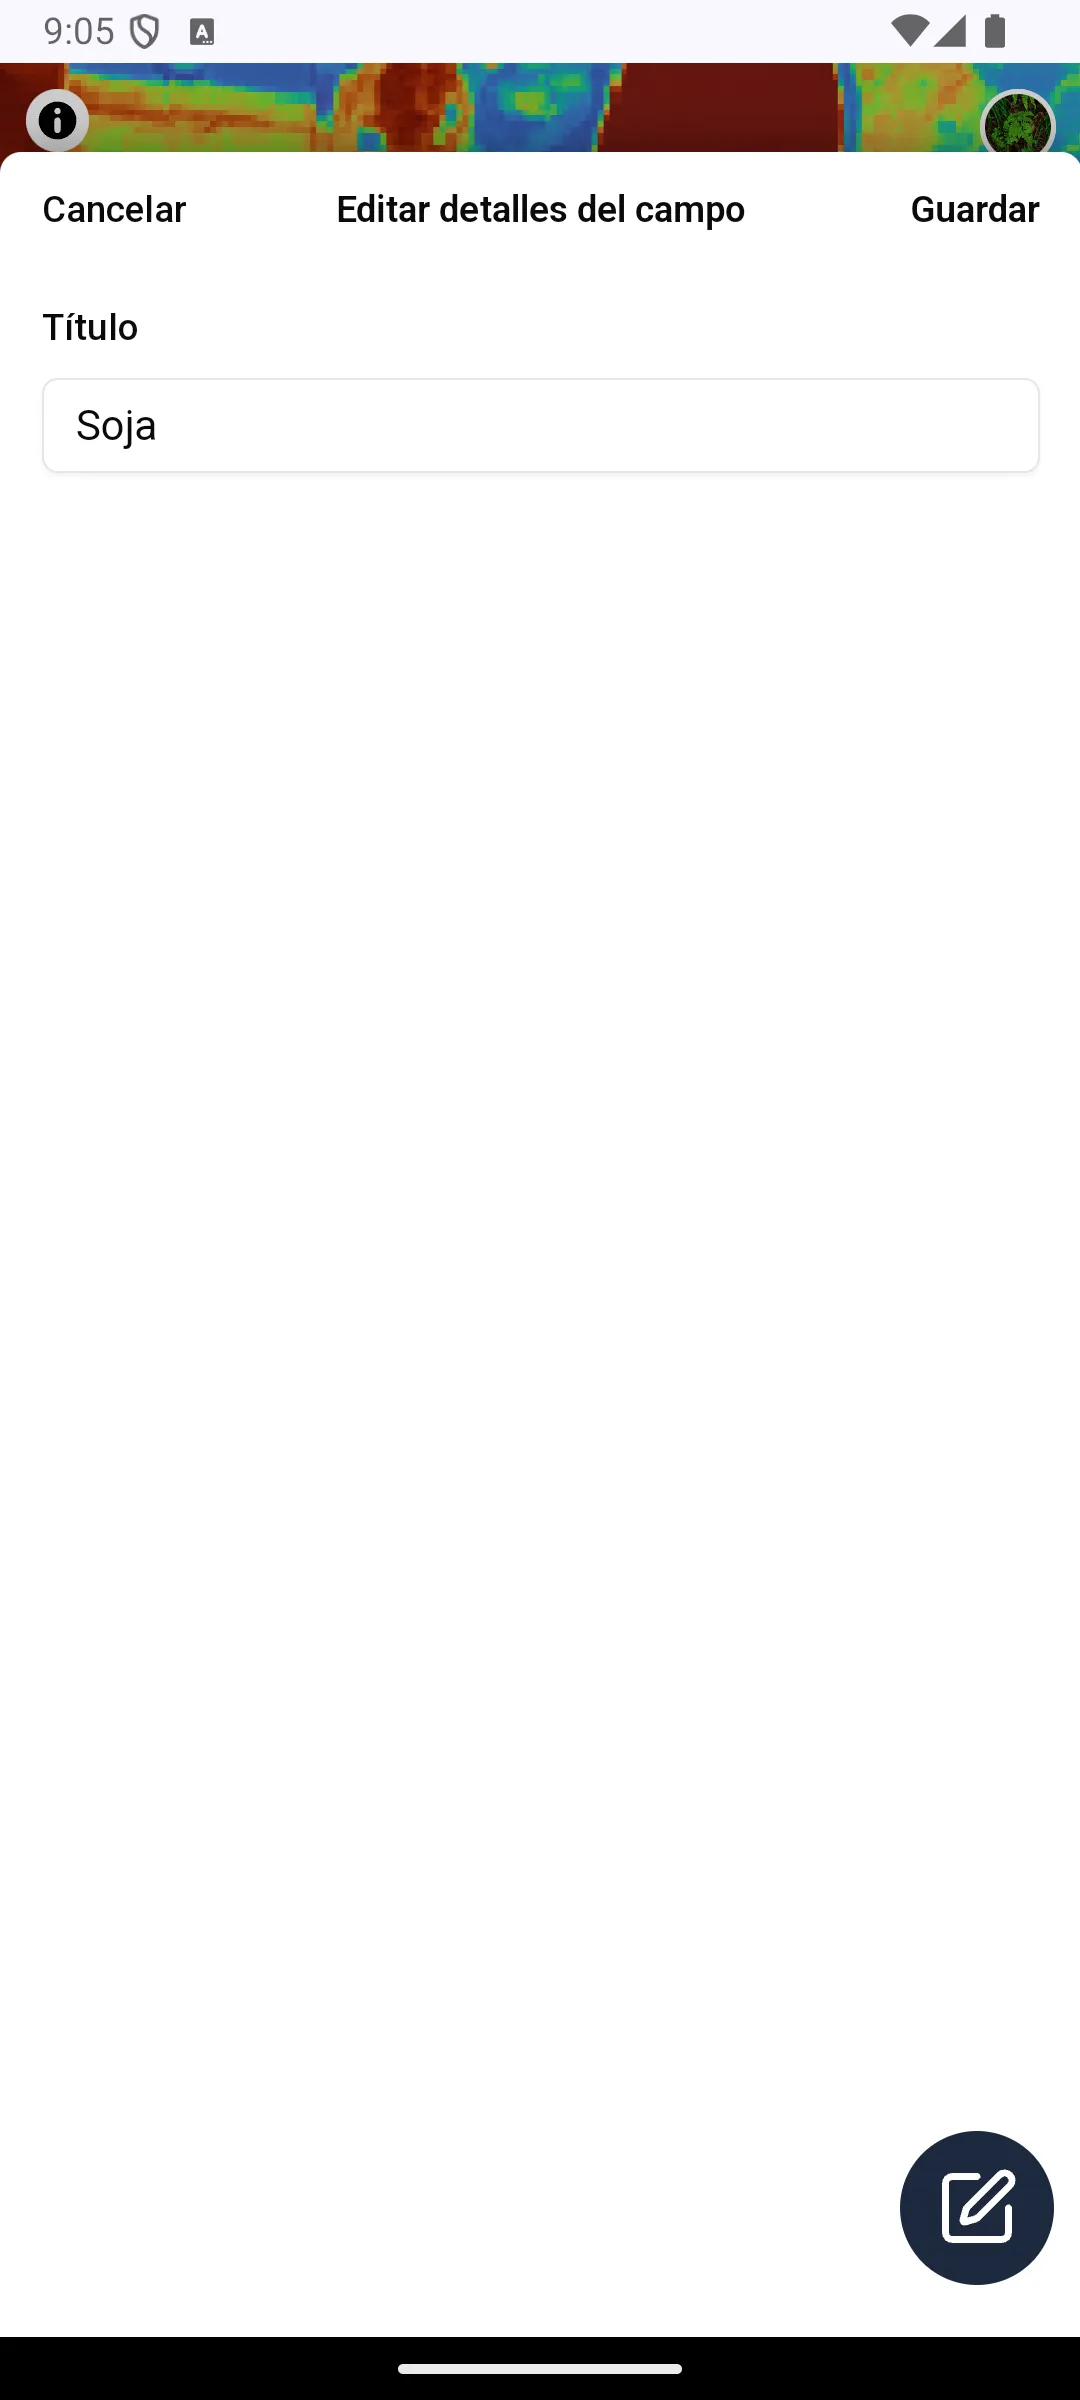
Once a bookmark is added, a list of bookmarks will be displayed at the bottom of the screen when no farmland is selected.
Bookmarked farmlands will also be shown in blue on the map. When the map is zoomed out to show a wide area, each farmland is shown as a blue dot. Tap a dot to zoom in until the shape of that farmland is visible.
Each row in the list shows an NDVI thumbnail generated from the latest cloud-free satellite image of the farmland, its capture date (N days ago), the area, and the approximate location.
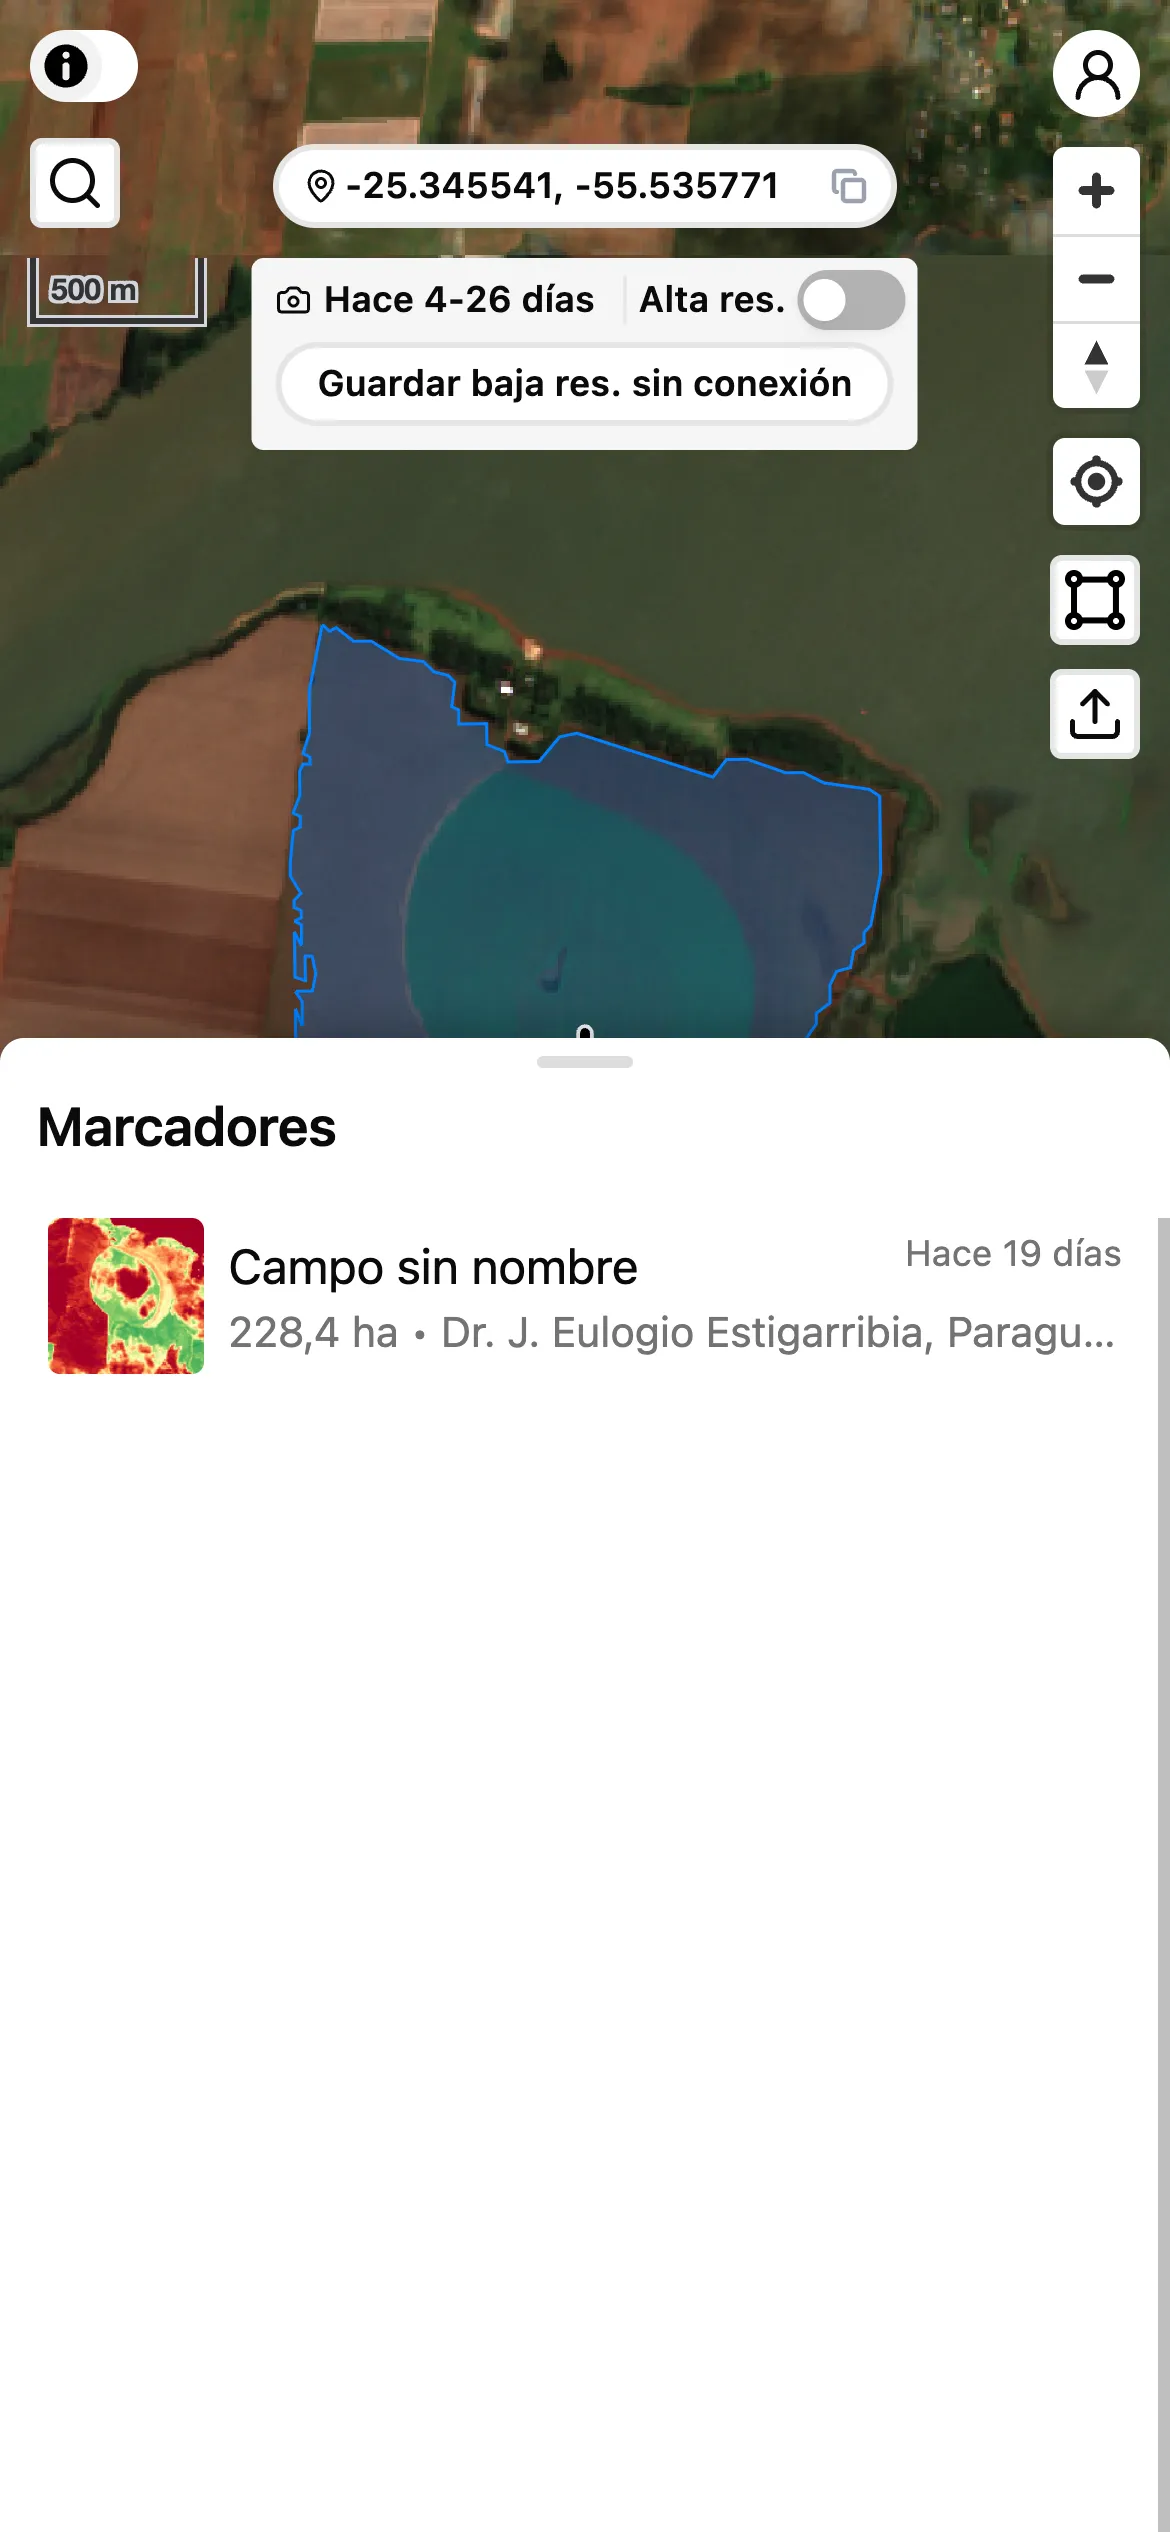
The list shows the first few bookmarks and loads more as you scroll down.
The heading row of the list holds the Missing data button (see below), the sort button and the Select button, and the row under it holds the count and the search button. Pressing the search button opens the input field to the right of the count.
The search covers the bookmark’s name, its description, and the values in its attribute table (attribute names are not searched). Numeric attributes match as text. Accents and letter case are ignored, so Ñandú is also found by typing nandu.
The sort dialog groups the orders under Date added, Name, Area, Sowing date (the FECHA DE SIEMBRA item), Image date (the capture date of the newest satellite image) and Last note (the day a note was last added), with rows such as Newest first or Largest first. You pick one row, so there is no separate direction to choose. The default is Date added / Newest first. With the default order the sort button shows only the icon; with any other order it shows a short heading (such as Sowing date) and an arrow for the direction (↓ or ↑).
Sorting by sowing date also shows the sowing date and the days since sowing on each row (a row with no sowing date shows Not entered, and a row whose value cannot be read as a date shows that value as it is). Sorting by the last note shows that date and time on each row, and a field with no notes shows No notes — not “not entered”, but nothing written yet. Sowing dates are read from formats such as 2024-05-01, 01/05/2024 (day first) and 20240501. Names treat digits as numbers, so field 2 comes before field 10. Rows with no value are always listed last, whichever order you pick; the dialog says so too.
The count shows how many bookmarks match, in the form 8 items (the list adds rows as you scroll, so this is not the number of rows on screen). When at least one farmland is missing declaration data, a Missing data button with that count appears in the heading row; pressing it narrows the list to those farmlands and shows the empty fields on each row. The count is taken among the farmlands that match your search, so it is the number you get when you press the button (without a search it covers every farmland, so it still reads as the remaining work).
The bottom line of each row always starts with the date the bookmark was added, followed by small labels for what the current conditions say about that row: the value you sorted by when sorting by sowing date or by the last note, the field a search matched other than the name, and the empty fields while you filter by Missing data. The labels go away when you drop the condition (the data has not changed). On the top right of each row, the date after the satellite icon is when the thumbnail’s satellite image was captured.
The search term, the sort settings and the filter are kept in the page URL, so they survive a reload.
To select a bookmarked farmland, either choose it from the list at the bottom of the screen or select it from the map as described in the Basic Usage section. To delete a bookmark, select it using the above method and then toggle the star button. Deleting a bookmark also permanently deletes its field boundary (detected or drawn, including excluded areas), its declaration data, and its notes and photos. This includes every season (see Seasons). This cannot be undone. The same applies when you delete several at once as described below.
To delete several bookmarks at once, press Select in the heading row of the list and tap the rows you want to delete. The same button turns into Cancel, which leaves without deleting. While selecting, the row below shows how many of the matching rows are selected, and the search stays available; Select shown picks only the rows shown in the list so far, and pressing it again after scrolling down adds the rows that have appeared since. The second number is every row that matches the search and filter, so it can stay higher than the number selected. Then press Delete (it shows how many are selected) and confirm. Changing the search, the sort or the filter clears the selection, so rows you can no longer see are never deleted. Delete cannot be pressed while offline.
Importing Farmland Data
Section titled “Importing Farmland Data”You can import farmland data in Shapefile, GeoJSON, or KML format as bookmarks.
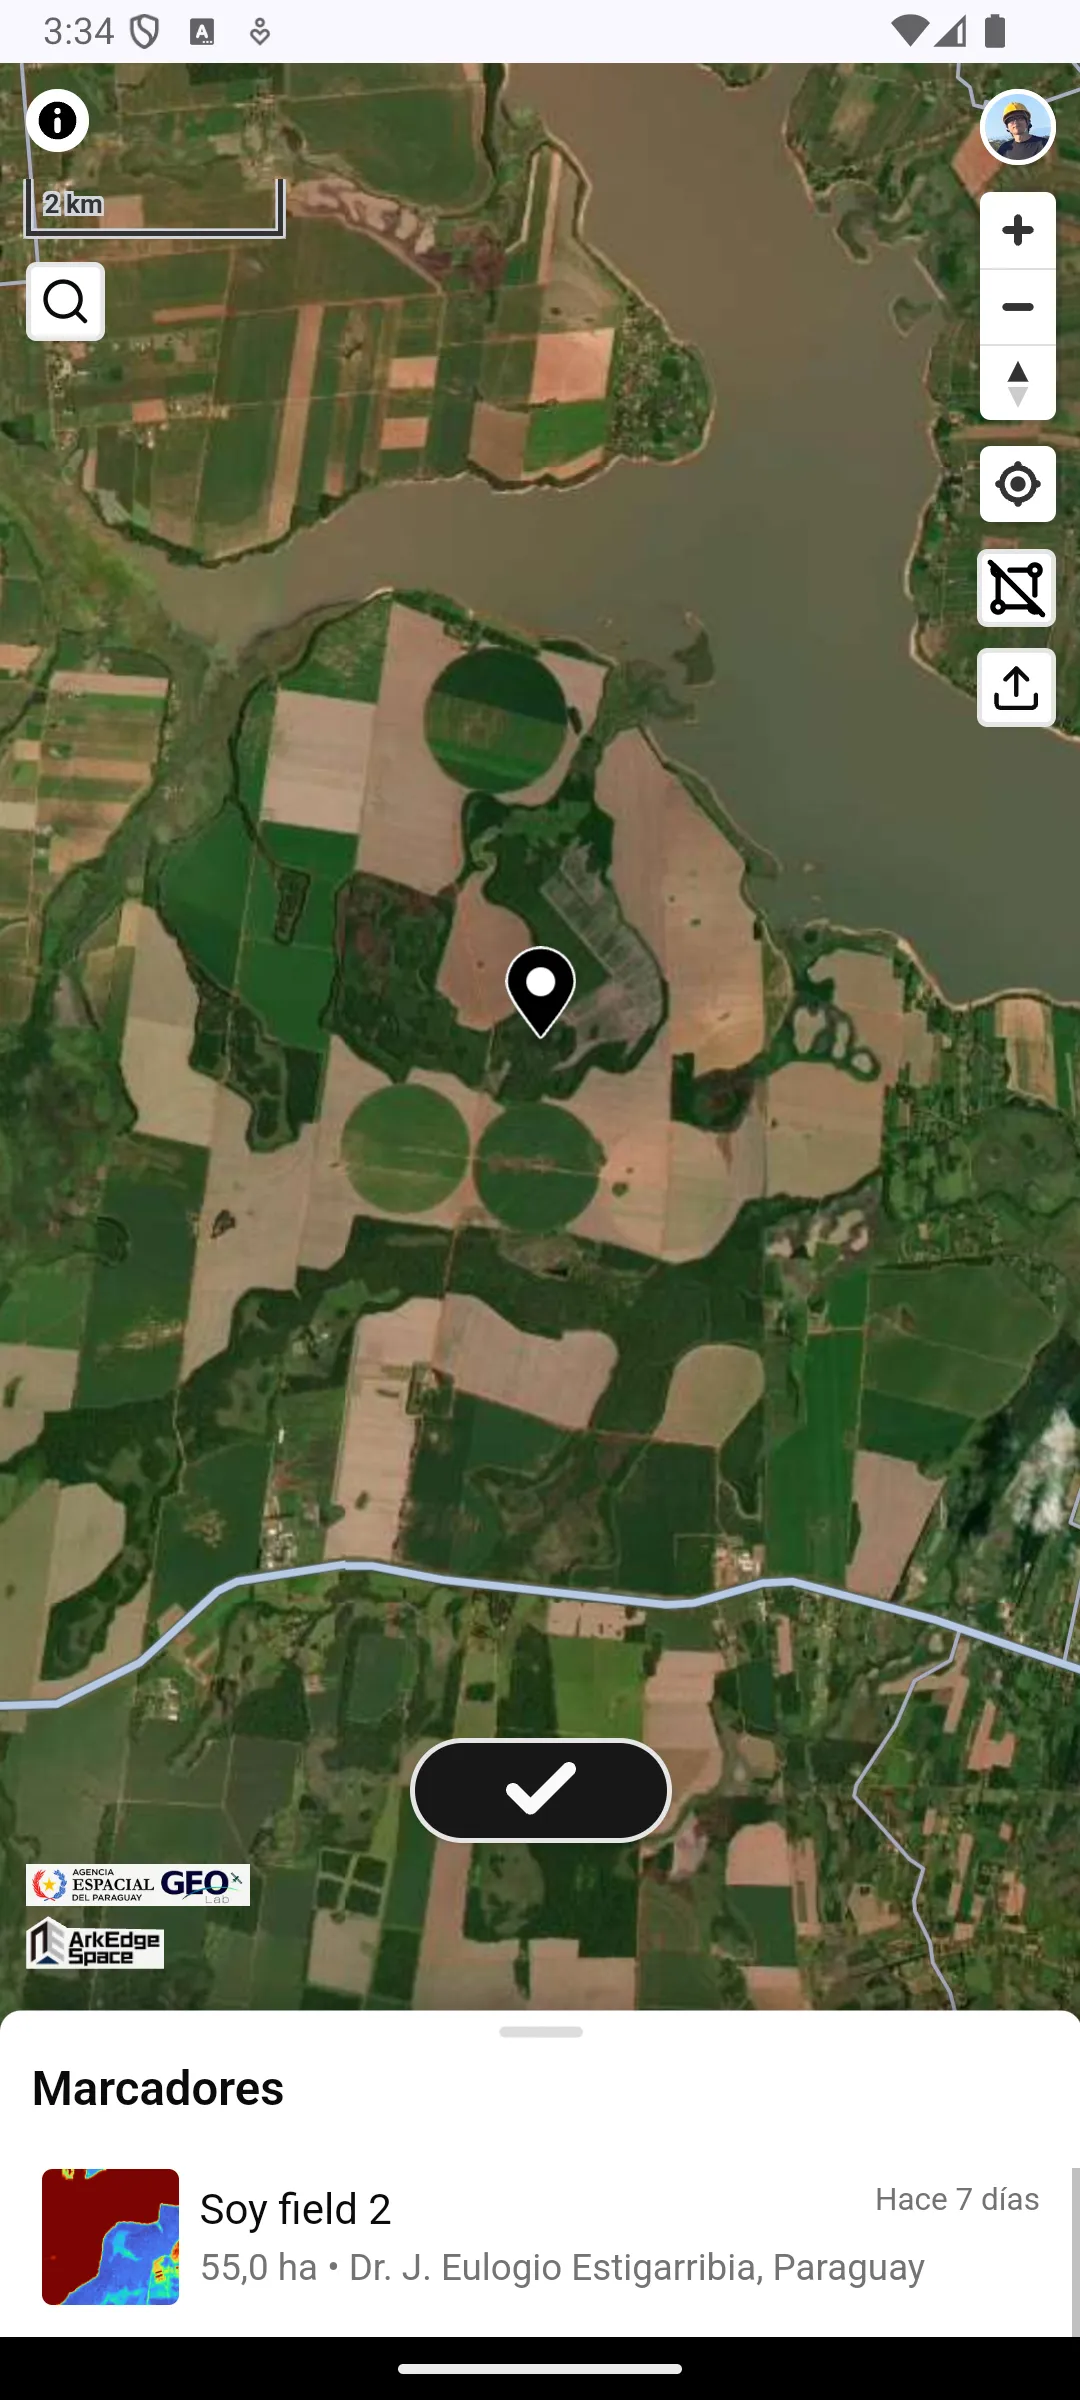
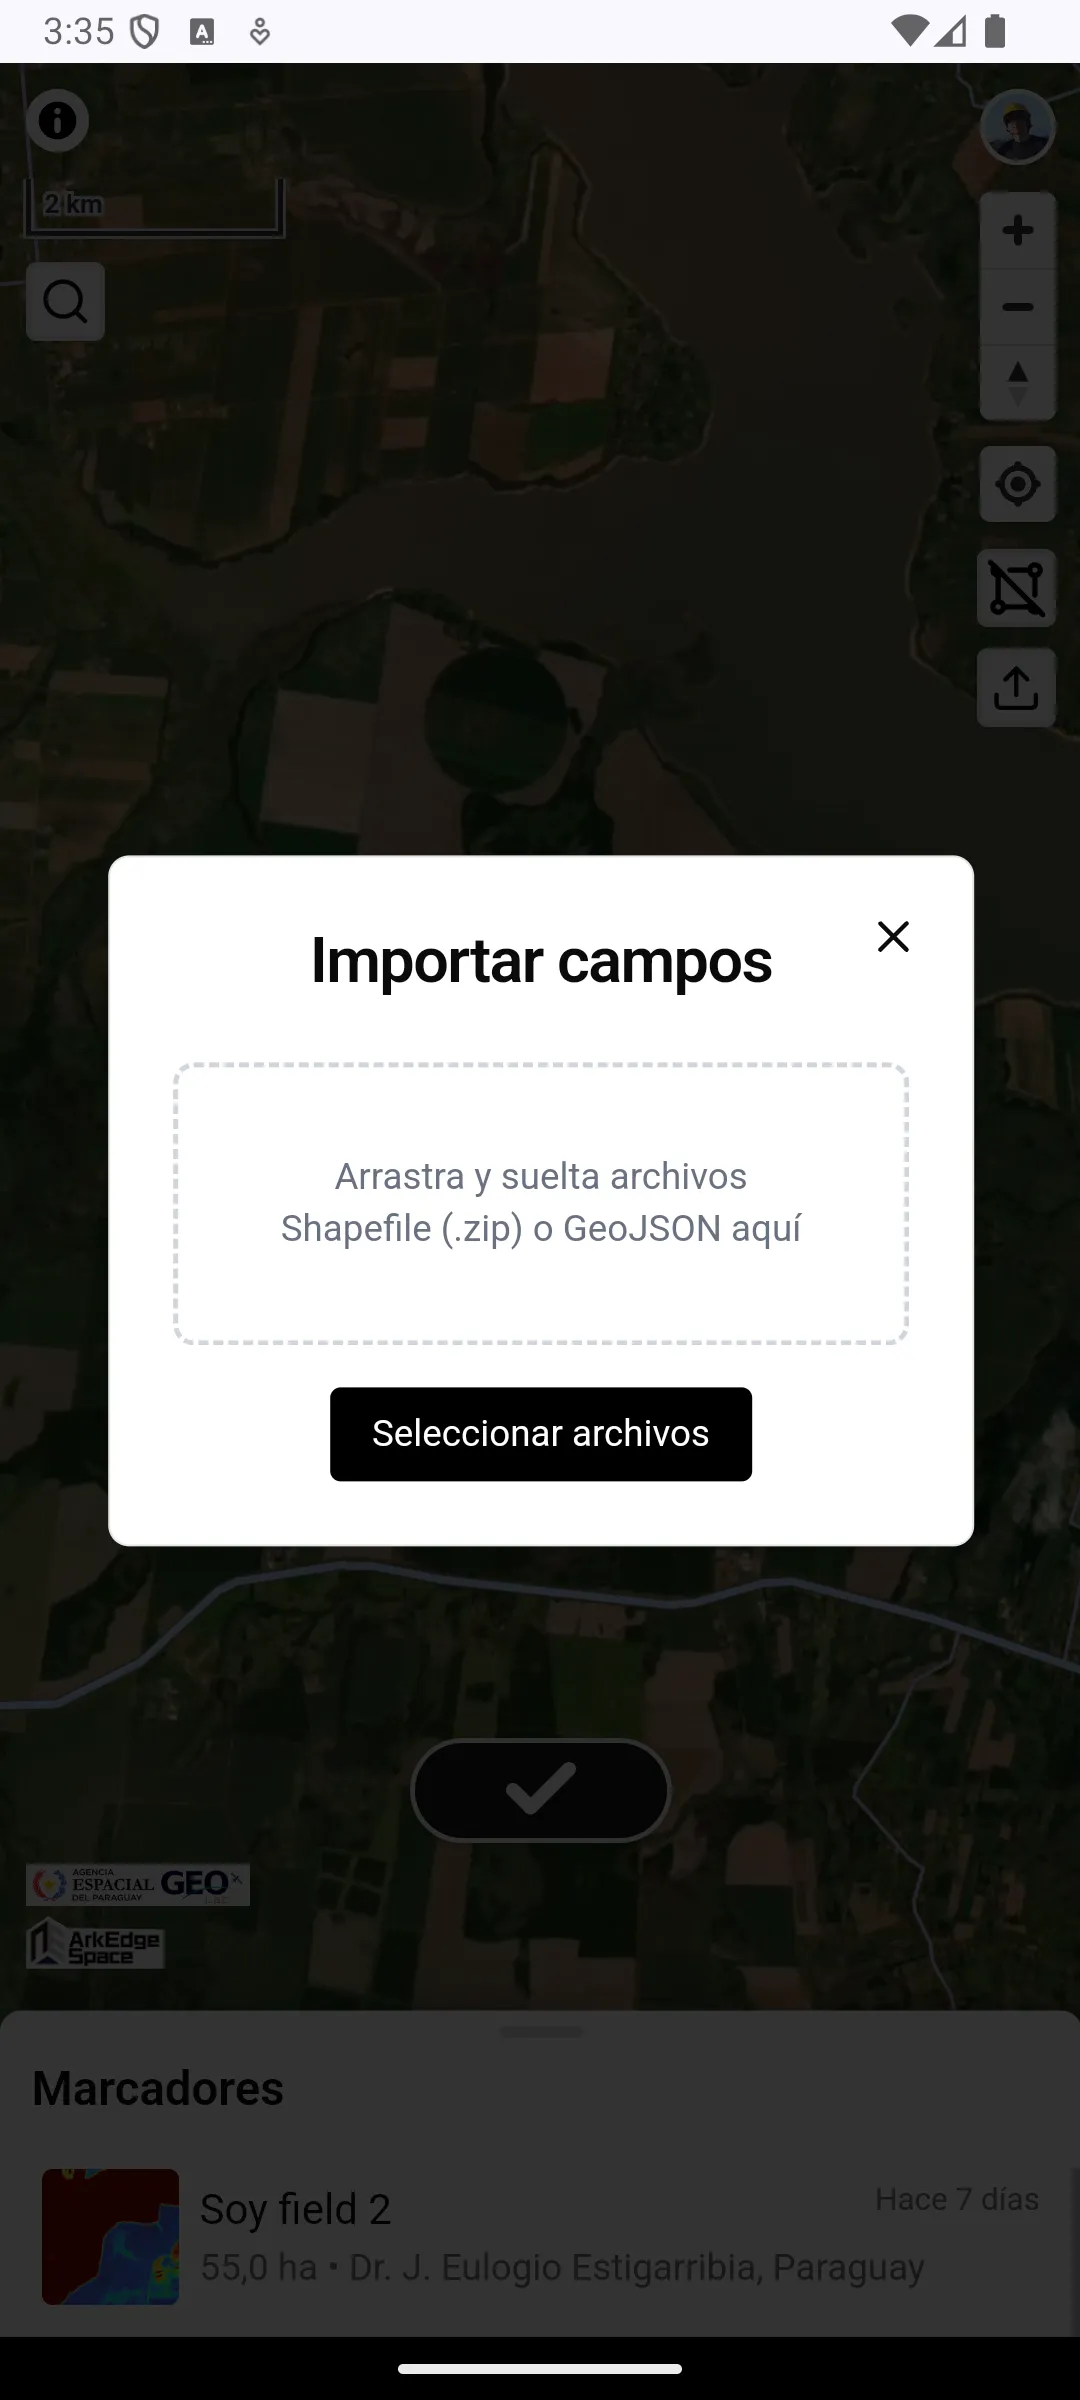
Tap the import button (up-arrow icon) in the top right corner of the screen to open the import dialog.
The following file formats are supported:
- Shapefile (either packaged as a
.zip, or by selecting.shp/.dbf/.prj/.cpgfiles together) - GeoJSON (
.geojson/.json) - KML (
.kml/.kmz). Display information such as colors is not kept in the attribute table
The information in the original file’s attribute table is preserved as the attribute table in the bookmark.
After you choose (or drop) the files, a dialog lists the files and asks what you are importing. The choice applies to the whole import:
Seed field(chosen at first): the declaration items go intoData for the seed field, and the other columns go intoOther dataEvaluation trial: the evaluation trial items (such asEVALUADORorNUM_VARIED) go intoData for the evaluation trialof the imported farmland, andData for the seed fieldstays empty, even for items the two share, such asESPECIE. A value that cannot be read as evaluation trial data, such asdosfor the number of varieties, does not stop the import; it is kept inOther data, and the message after the import names its column. The other columns go intoOther dataOther: every column goes intoOther data
A column put into Other data keeps its name, even when it has the same name as
a declaration item or an evaluation trial item (such as ESPECIE). A farmland
imported with Evaluation trial or Other
has an empty Data for the seed field, so it counts as missing data in the list.
If the file has a column that holds a name (such as name or nombre), its
values become the field names. The name given to a KML in Google Earth, GPS
Fields Area Measure, or a similar app counts as such a column. If there is no
such column, after choosing what you are importing, you can choose, for each
file, which column to use for the field names. If you choose Don't use (file name and number), or
the file has no usable column, the file name and a number are used. Fields whose
value in the chosen column is empty also get the file name and a number, and
duplicate names get a number appended. When the name column is used for the
field names, that column is not kept in the attribute table.
When importing as Seed field, columns with the short names used in the
download (such as CAT_SEMB, FECHA_SIEM or SUP_DECL) are read as the
declaration items. Columns named as
shown in the app (such as CATEGORIA SEMBRADA, FECHA DE SIEMBRA or
SUPERFICIE DECLARADA) are read as the same items. If a file has both, the
short name is used, and the other column is kept in Other data.
To undo an import, press Undo on the message that appears when the import
succeeds, and confirm; the farmlands you just imported are deleted. The message
stays for 15 seconds.
If an import stops partway, for example because of a network error or because
the bookmark limit is reached, the error shows how many farmlands were imported
and how many were not. Press a button such as Retry the remaining 3 fields to
import the rest without duplicating the farmlands that were already imported,
or a button such as Delete the 2 imported fields to delete the farmlands that
were already imported. If you close the dialog instead, you can no longer retry,
and importing the same file again adds the farmlands that were already imported
a second time.
Data Download
Section titled “Data Download”CSV data and GeoTIFF images can be downloaded by selecting the target period from the date picker. Check the data you want to download, then tap the download button.
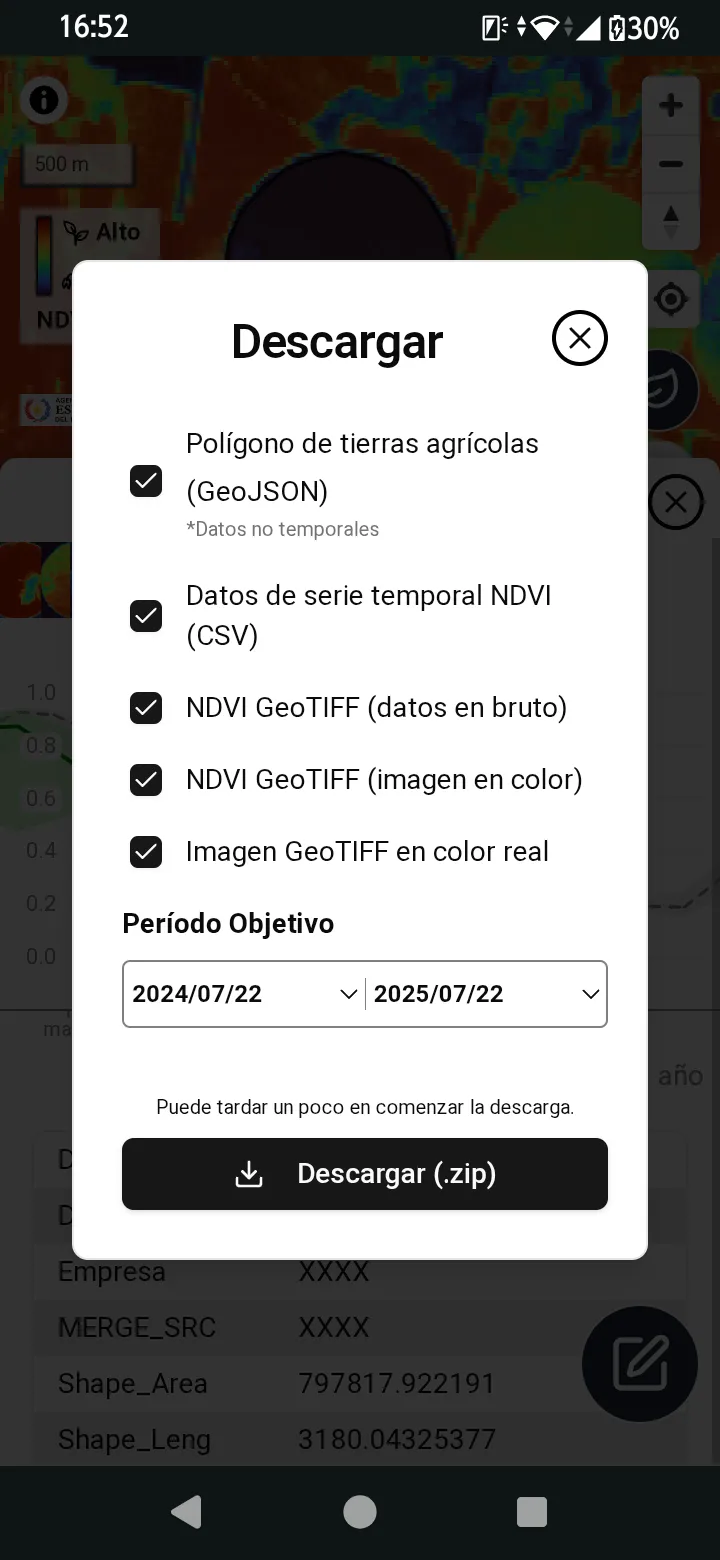
The following data can be downloaded:
- Agricultural farmland polygon (GeoJSON). The polygon and the declaration data are those of the selected season (see Seasons). The farmland’s
Other datais included only whenInclude other datais checked. Below it, you can choose which declaration data goes into the attributes:Seed field(chosen at first) orEvaluation trial. LikeInclude other data, this choice cannot be used while the polygon is unchecked. WithEvaluation trial, the evaluation trial items are included instead of the items ofData for the seed field, under the column namesEVALUADOR,ESPECIE,NUM_VARIED,NUM_REPET,SUP_PARCEL,FECHA_SIEM,DPTO,DISTRITOandFECHA_APRO, in this order, and a field left blank has an empty value (the two declarations share items such asESPECIE, so only one of them can go in). IfOther datahas a column with the same name as an item of the chosen declaration data, the declaration data’s value is used.Evaluation trialcan be chosen under the same conditions asData for the evaluation trialis shown (see Evaluation Trial Data) - NDVI time series data (CSV)
- NDVI GeoTIFF (raw data)
- NDVI GeoTIFF (color image)
- True color GeoTIFF image
Polygon Editing
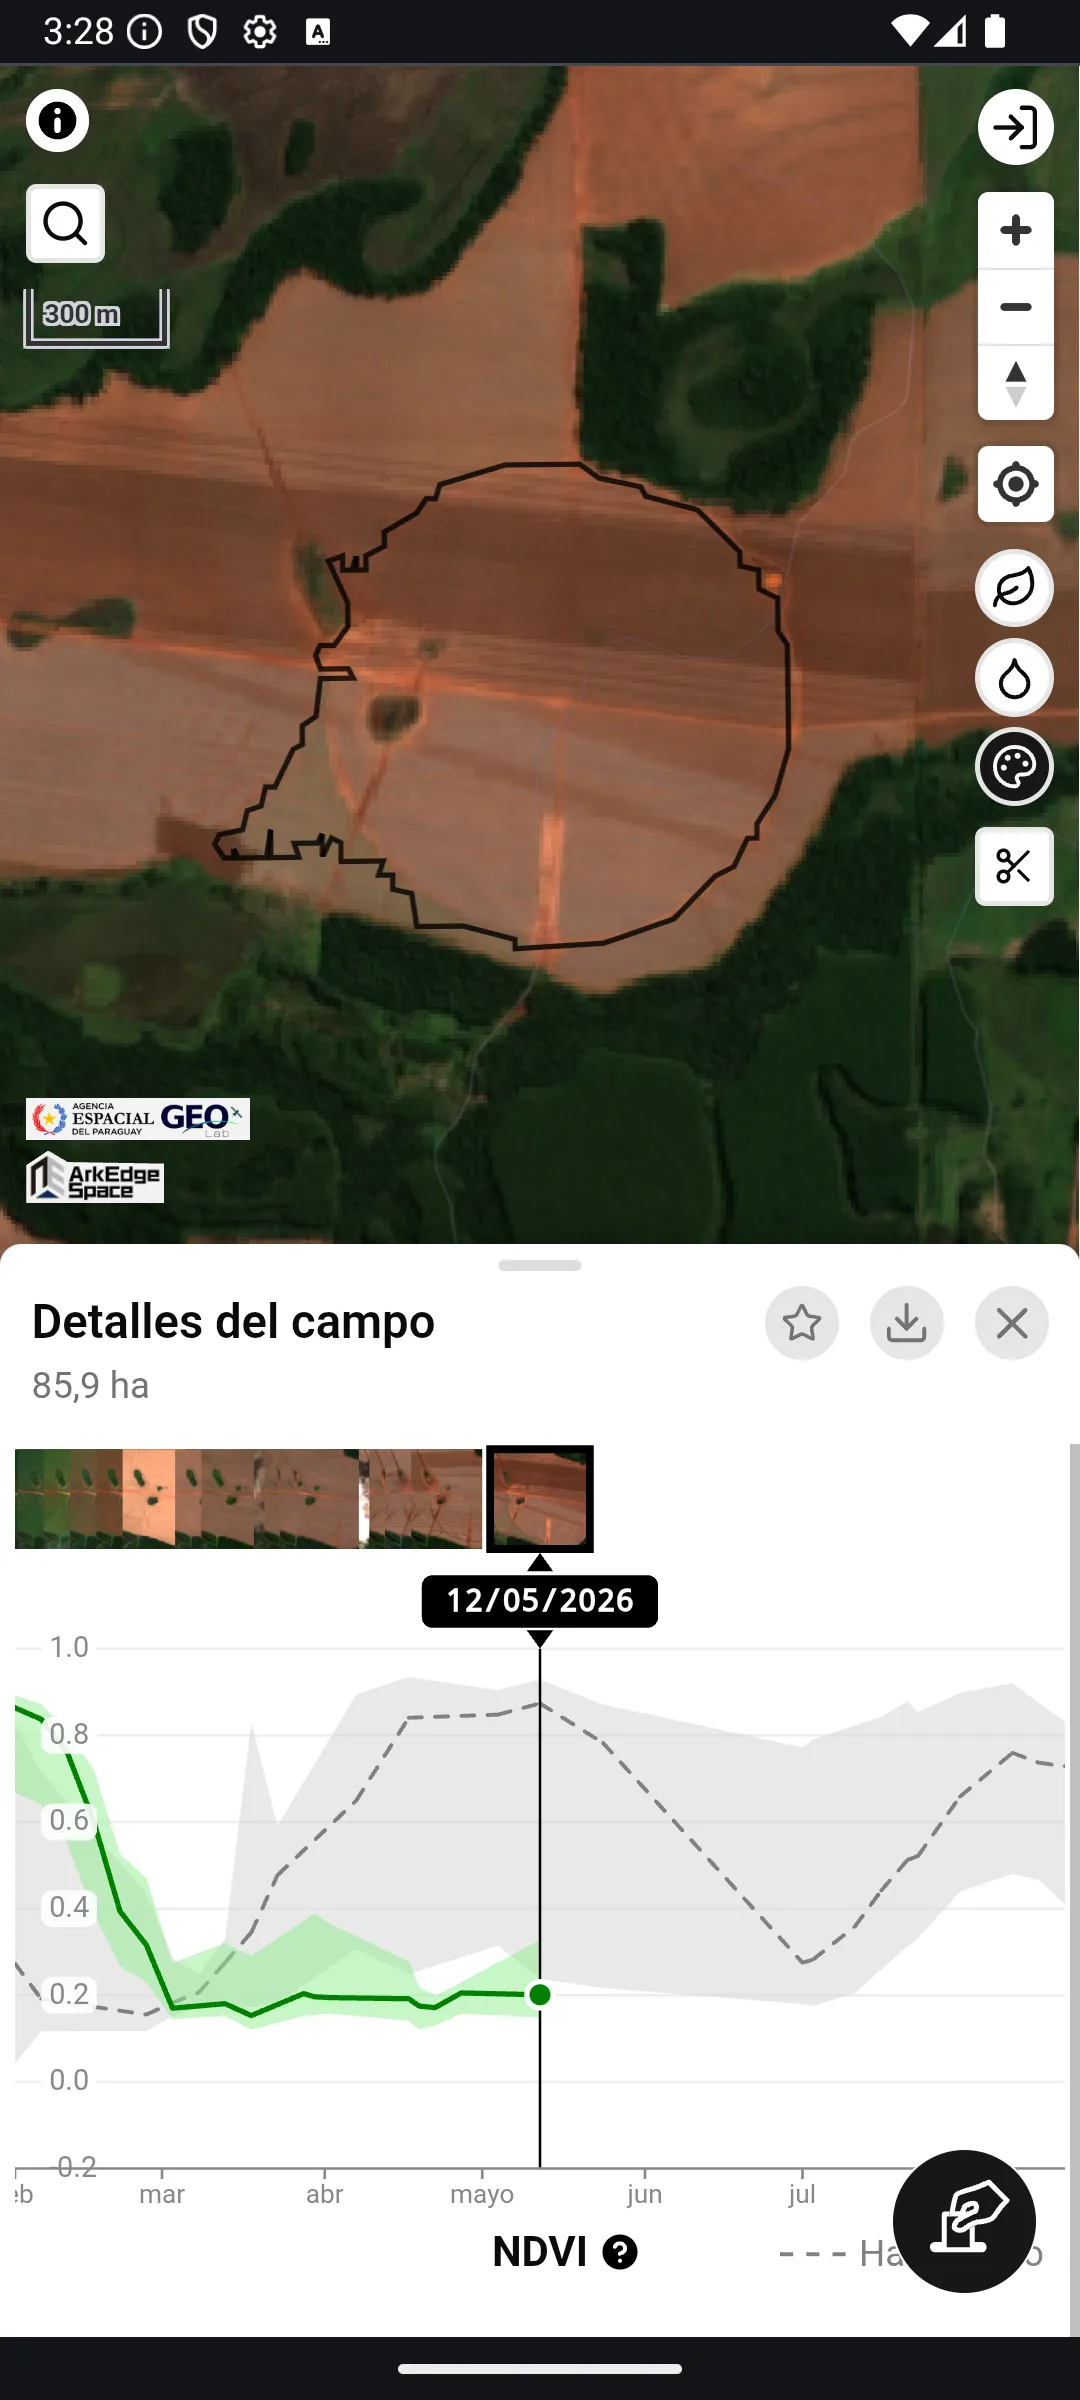
Section titled “Polygon Editing”After selecting a farmland, tap the button to enter polygon editing mode. On a bookmarked farmland, the editing changes the polygon of the selected season only (see Seasons). Use the toolbar at the bottom of the screen to choose an editing method.
Manual Exclusion Drawing
Section titled “Manual Exclusion Drawing”Select the button to manually draw an area to exclude by placing points on the map to create a rectangle (shown in red).
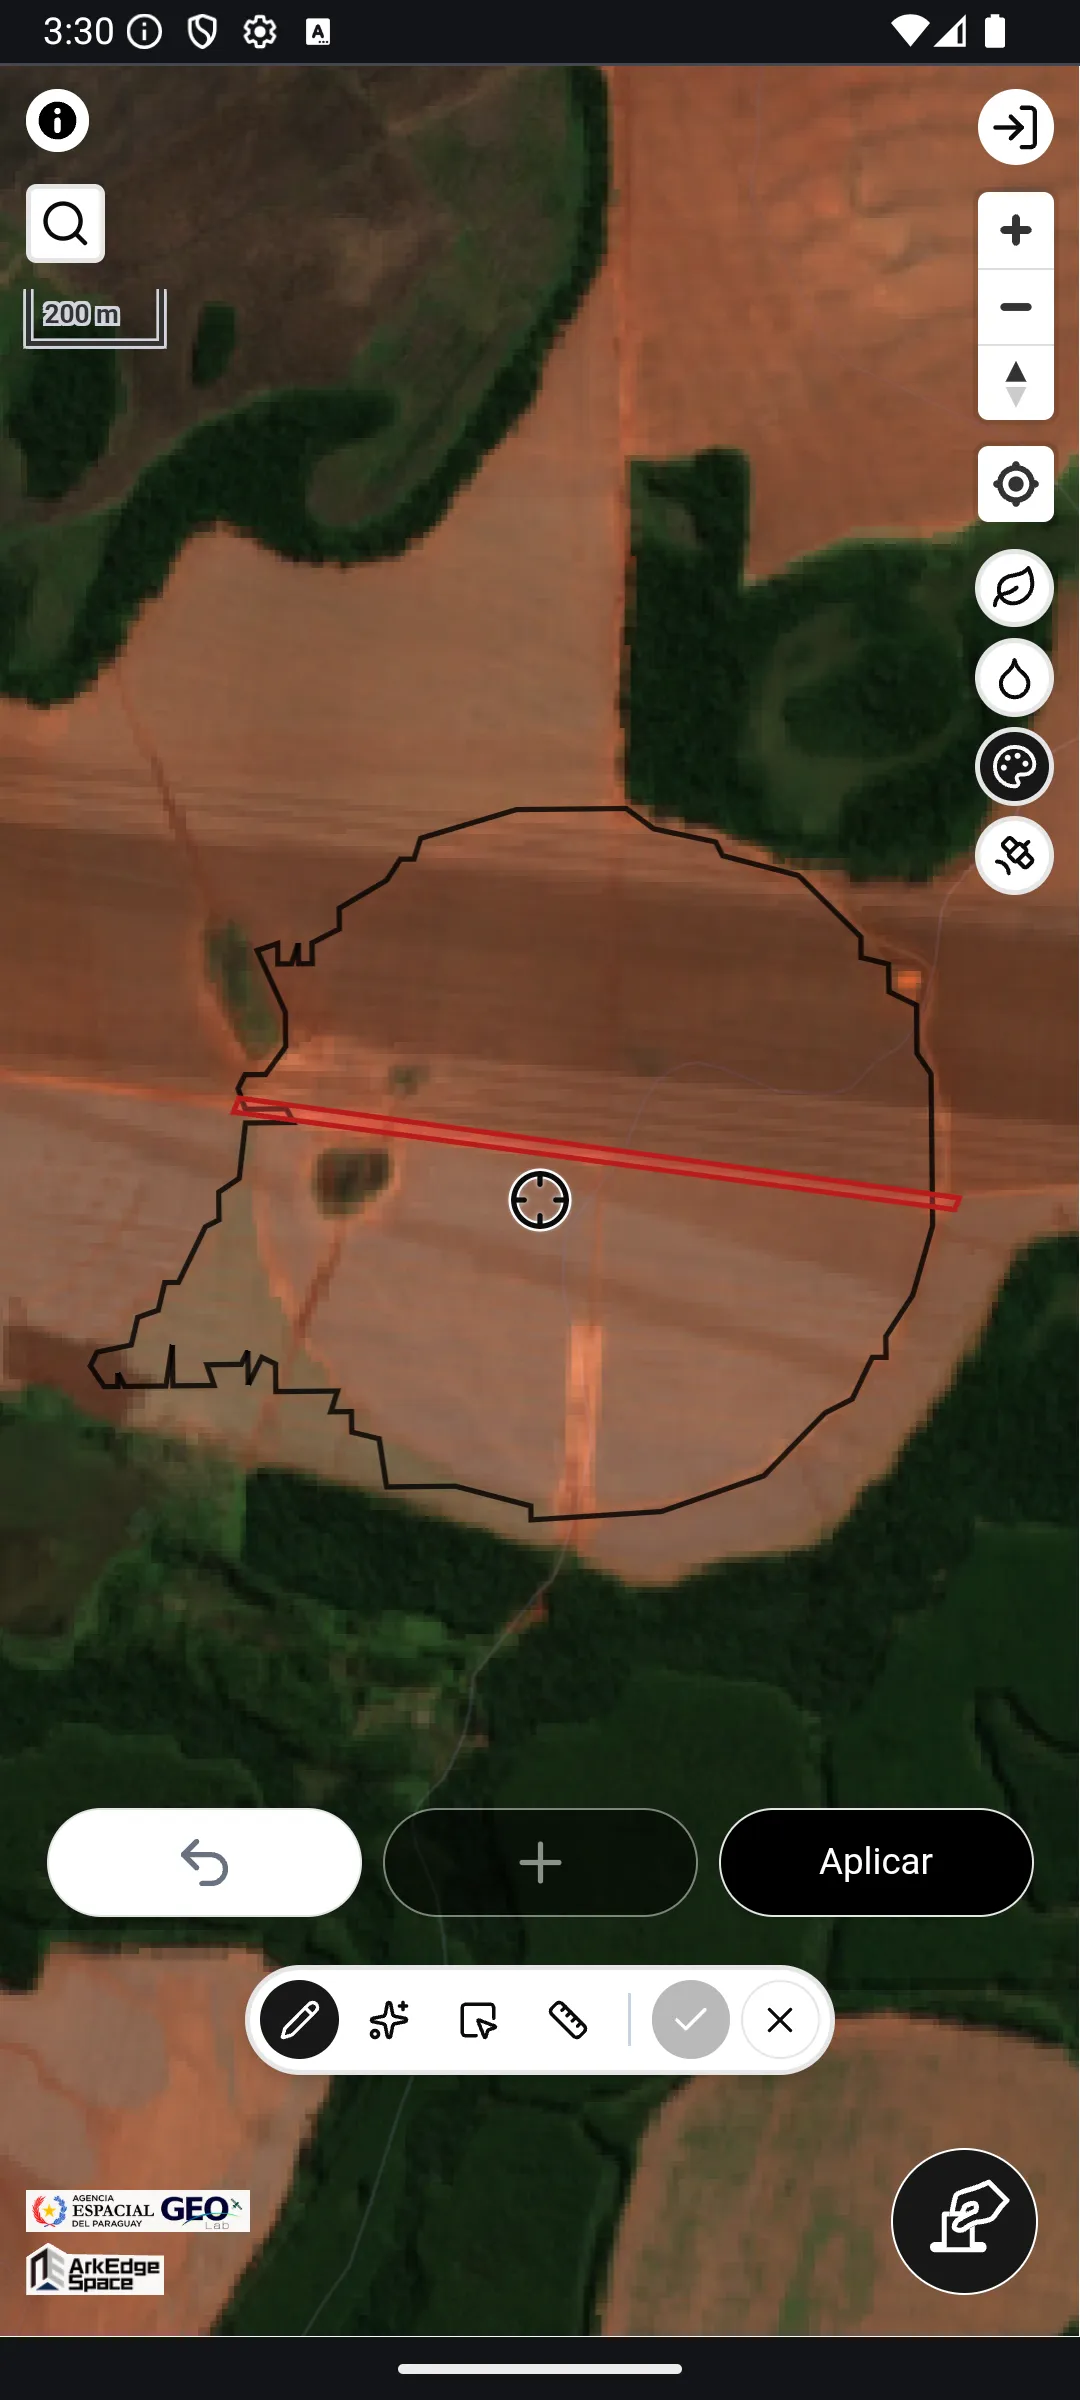
Multi-seed Exclusion Generation
Section titled “Multi-seed Exclusion Generation”Select the button to automatically generate exclusion polygons by placing multiple seed points on the map.
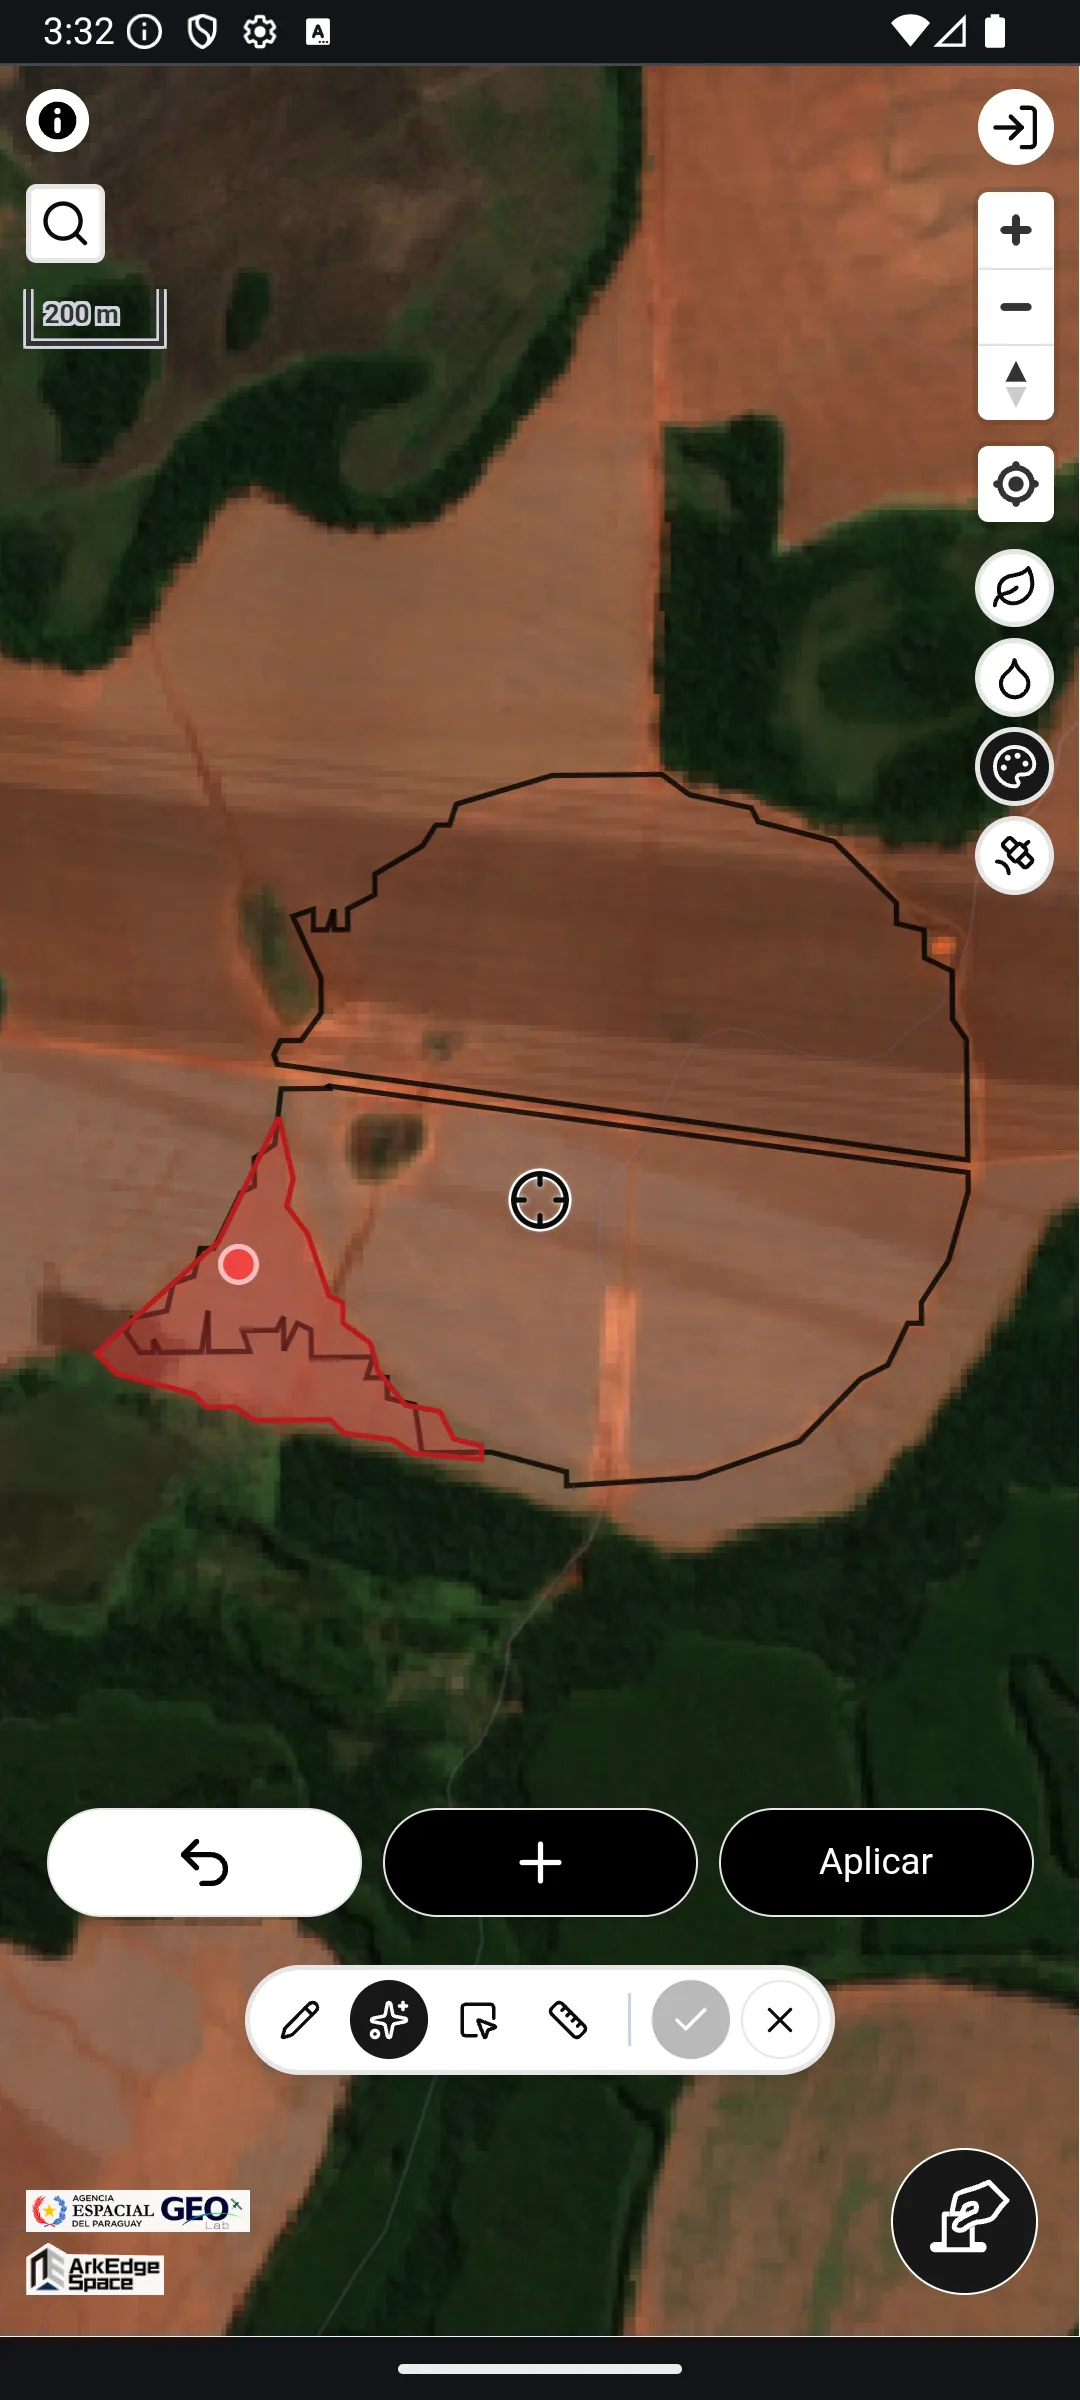
- Position the map center pin over the area to exclude (e.g., irrigation equipment), then tap the + button to add a seed (up to 10 locations)
- After a moment, the auto-detected exclusion area (shown in red) will appear
- Once you have added all desired exclusion areas, tap “Apply” to confirm
Exclusion by Polygon Selection
Section titled “Exclusion by Polygon Selection”The button is available when a farmland consists of multiple polygons. Tap individual polygons to select them (highlighted in red), then tap “Apply” to exclude the selected polygons.
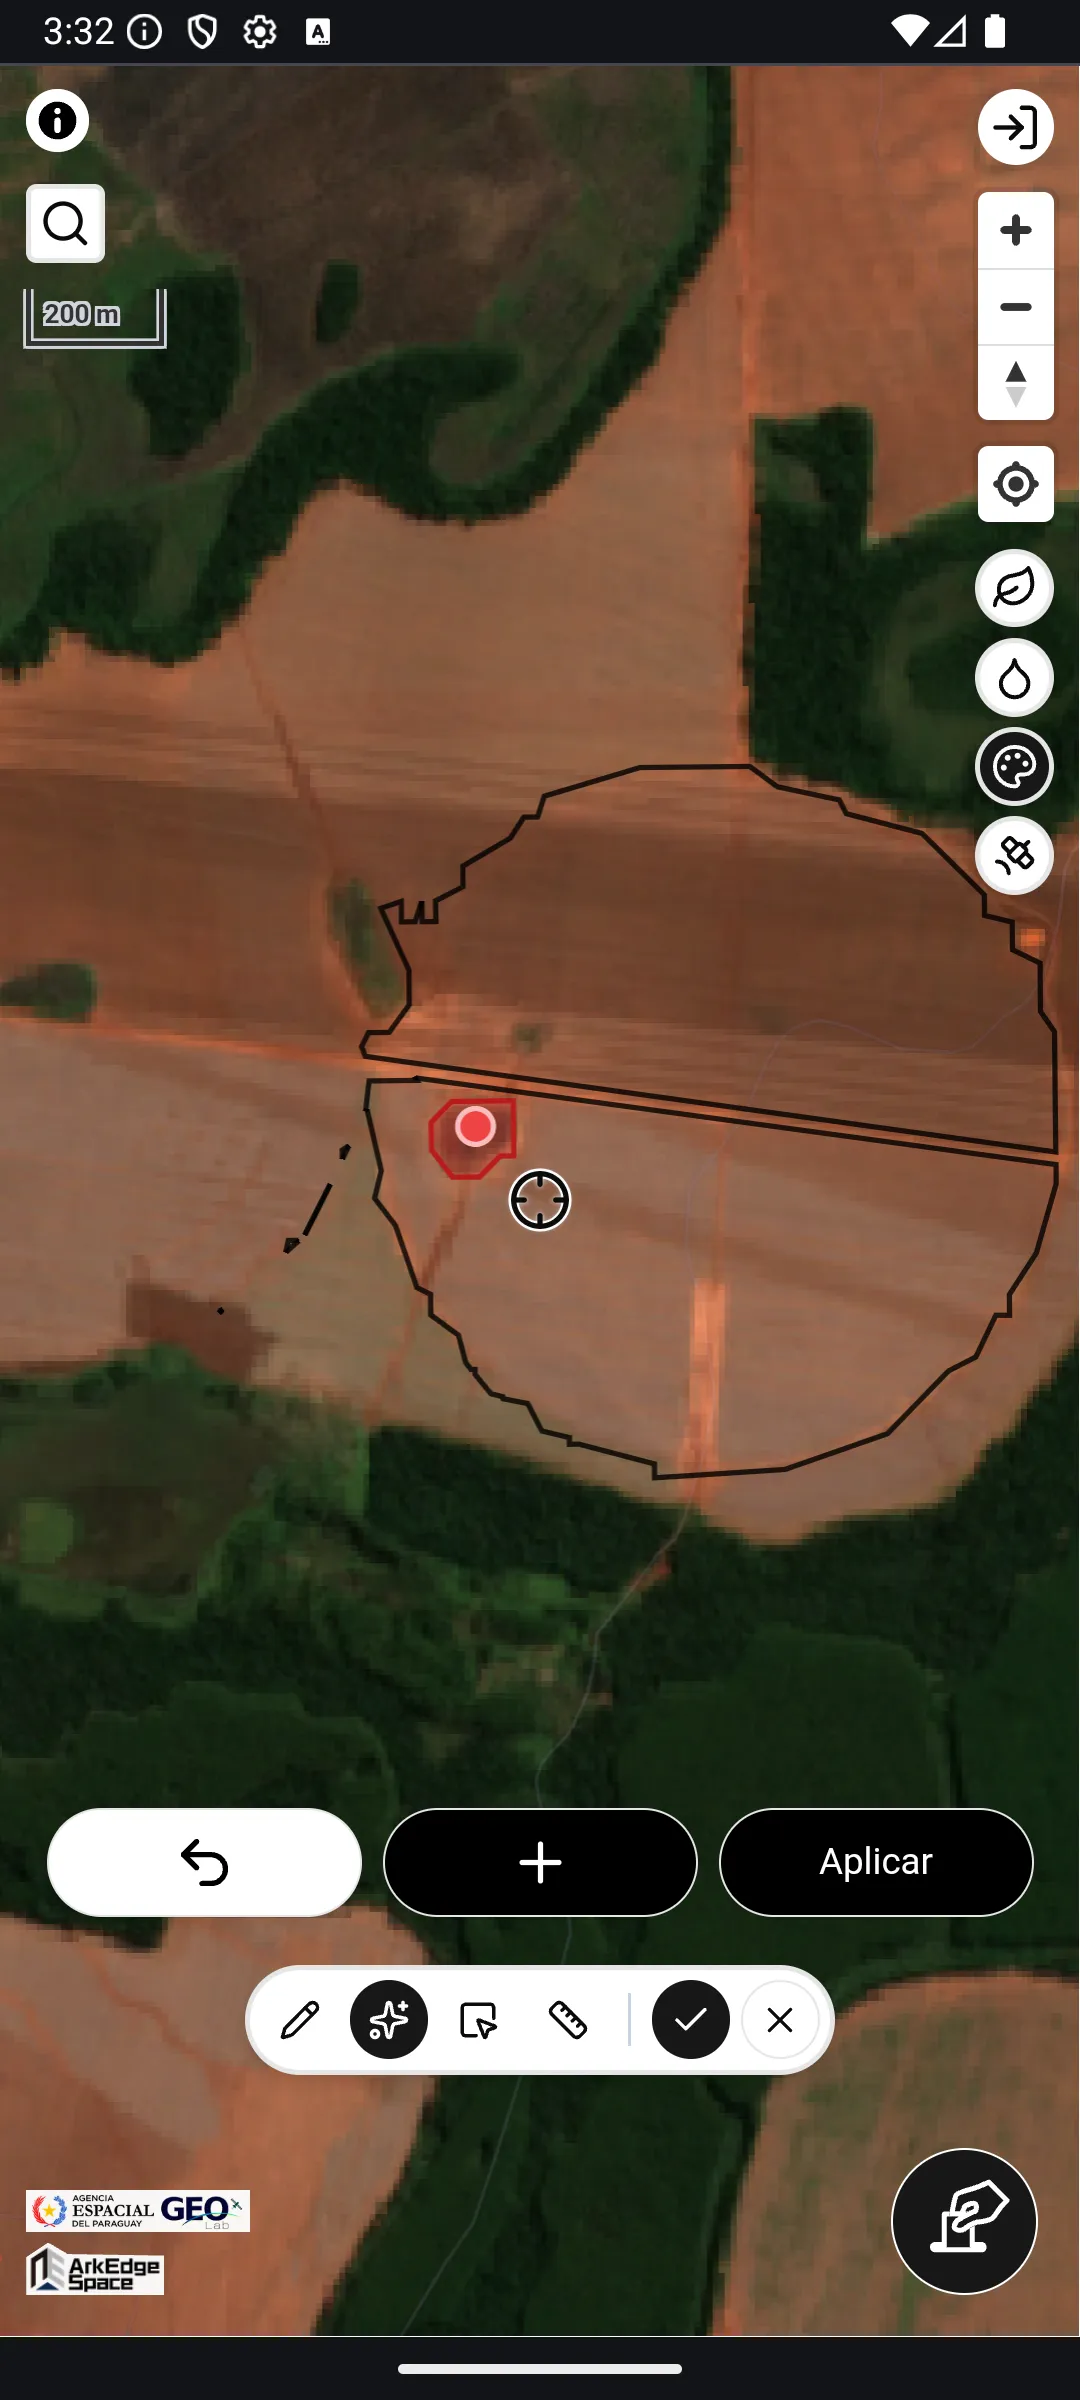
Area Adjustment
Section titled “Area Adjustment”Select the button to adjust the farmland polygon area numerically. Enter a target area (in hectares) and a preview of the adjusted shape will appear on the map as a green dashed line. After confirming, tap “Apply” to apply the change.
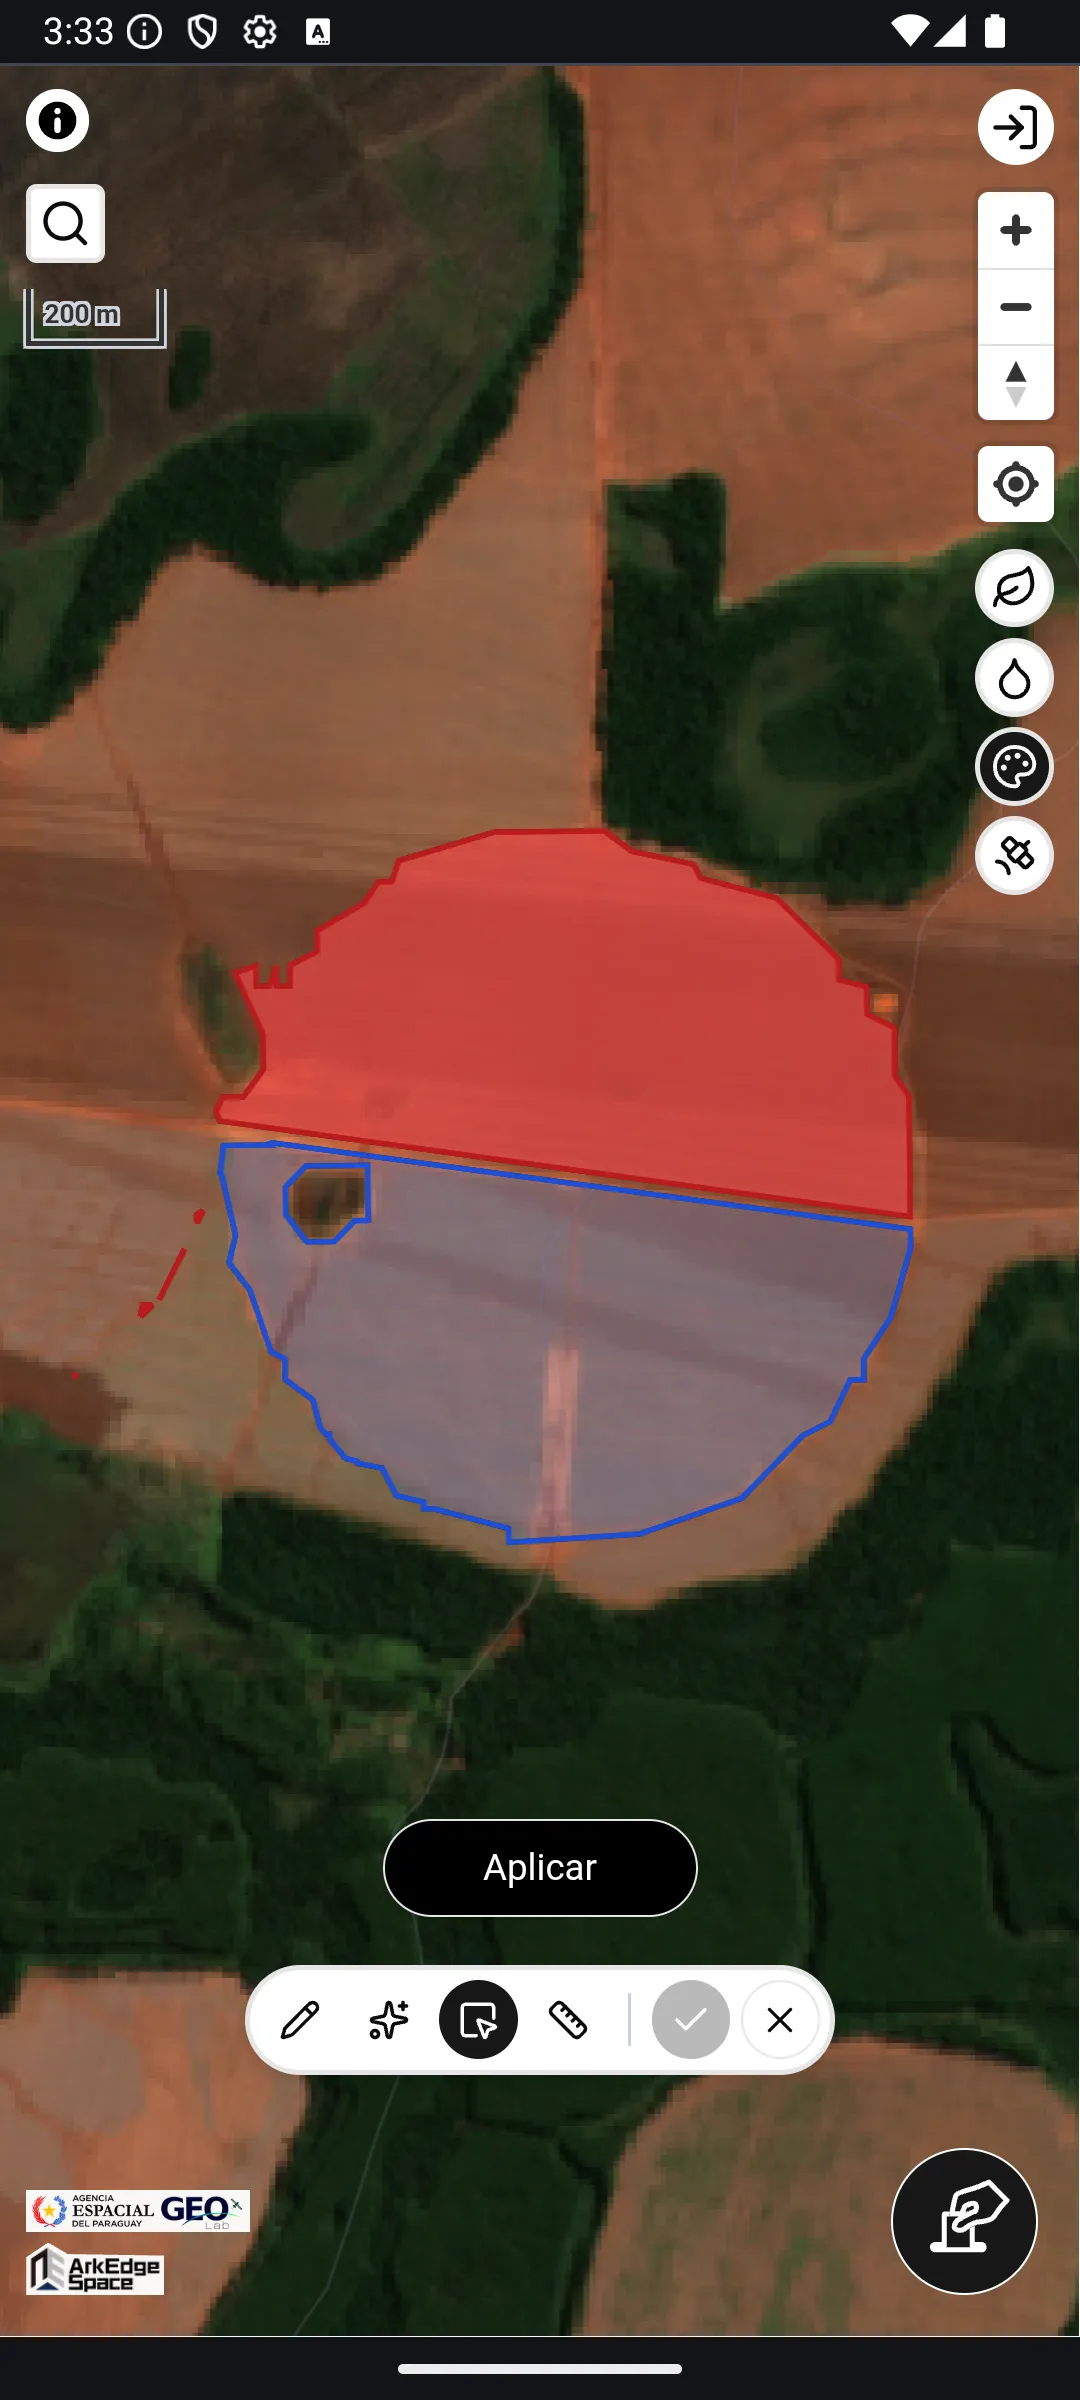
Hi-Res Display During Editing
Section titled “Hi-Res Display During Editing”During editing, a toggle () is available to switch to high-resolution (Hi-Res) display. Use this when you need to check fine boundaries while editing.
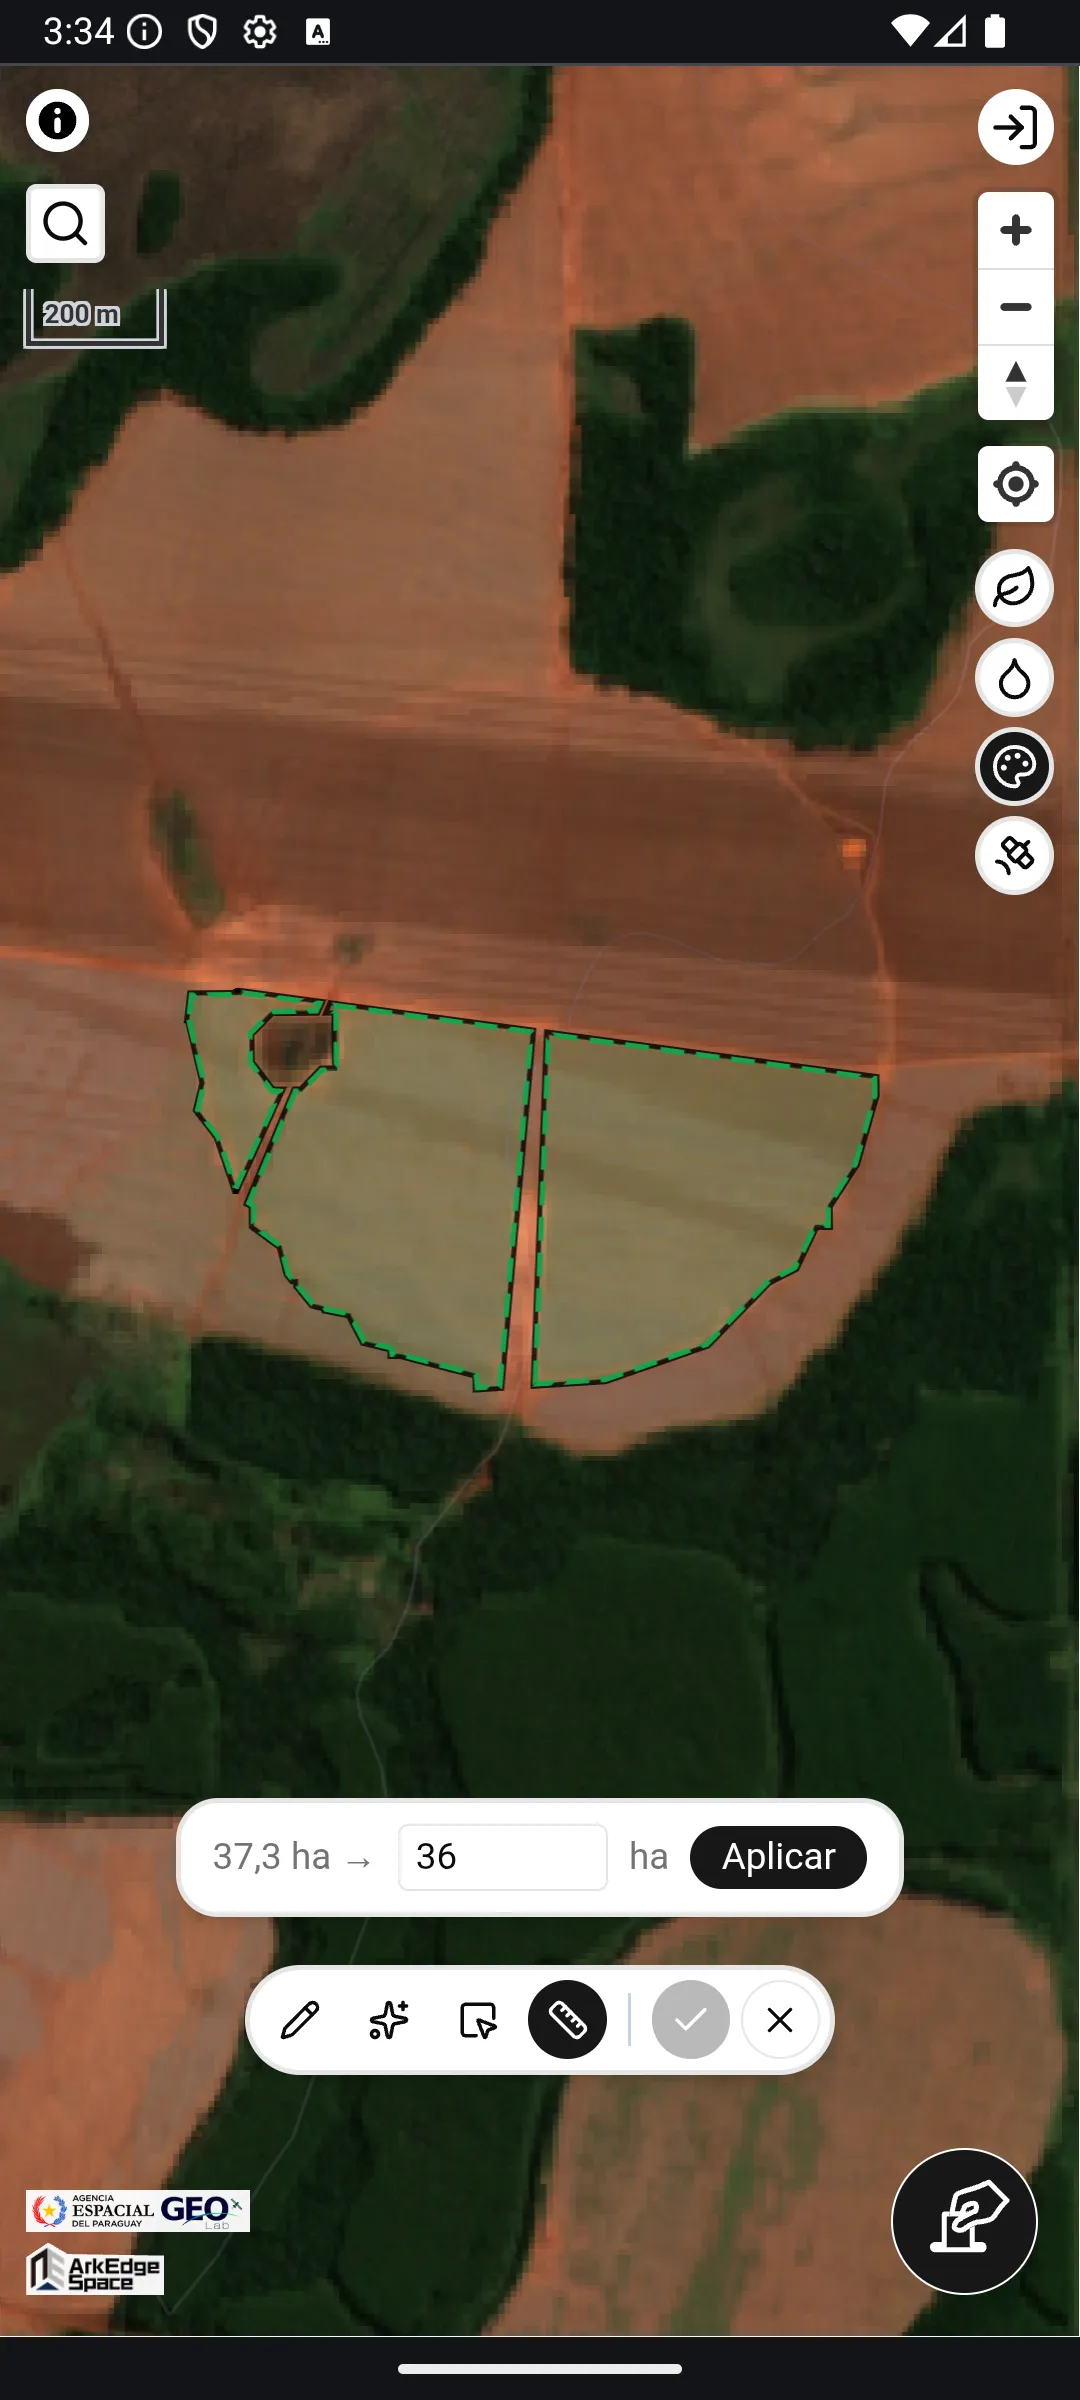
Confirm or Cancel Editing
Section titled “Confirm or Cancel Editing”Tap the button to confirm all edits. Tap the button to discard all edits and cancel.
Using the App with a Mouse (PC)
Section titled “Using the App with a Mouse (PC)”In a browser on a PC, mouse-specific operations are available in addition to the same steps as touch operation:
- Hovering over a farmland polygon on the map (such as a bookmark) highlights it, and clicking selects it directly
- Clicking an empty spot moves the map center to that point
- While editing a polygon, click to place vertices and seed points. During manual drawing, a guide line is shown from the last vertex to the mouse position
In addition, when the screen is wide enough, the details view is displayed in two columns — the graph and the attribute inputs — and the graph shows a longer time range.